. 2011 Dec 6;108(49):E1293-301.
doi: 10.1073/pnas.1111471108. Epub 2011 Nov 21.

Direct-coupling analysis of residue coevolution captures native contacts across many protein families

Affiliations

Direct-coupling analysis of residue coevolution captures native contacts across many protein families

Faruck Morcos et al. Proc Natl Acad Sci U S A. .

Abstract

The similarity in the three-dimensional structures of homologous proteins imposes strong constraints on their sequence variability. It has long been suggested that the resulting correlations among amino acid compositions at different sequence positions can be exploited to infer spatial contacts within the tertiary protein structure. Crucial to this inference is the ability to disentangle direct and indirect correlations, as accomplished by the recently introduced direct-coupling analysis (DCA). Here we develop a computationally efficient implementation of DCA, which allows us to evaluate the accuracy of contact prediction by DCA for a large number of protein domains, based purely on sequence information. DCA is shown to yield a large number of correctly predicted contacts, recapitulating the global structure of the contact map for the majority of the protein domains examined. Furthermore, our analysis captures clear signals beyond intradomain residue contacts, arising, e.g., from alternative protein conformations, ligand-mediated residue couplings, and interdomain interactions in protein oligomers. Our findings suggest that contacts predicted by DCA can be used as a reliable guide to facilitate computational predictions of alternative protein conformations, protein complex formation, and even the de novo prediction of protein domain structures, contingent on the existence of a large number of homologous sequences which are being rapidly made available due to advances in genome sequencing.


Conflict of interest statement

The authors declare no conflict of interest.

Figures
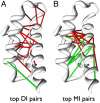
Fig. 1.
Fig. 1.
Contact predictions for the family of domains homologous to Region 2 of the bacterial Sigma factor (Pfam ID PF04542) mapped to the sequence of the SigmaE factor of E. coli (encoded by rpoE) (PDB ID 1OR7). A shows the top 20 DI predictions, and B shows the top 20 MI predictions for residue–residue contacts, both with a minimum separation of five positions along the backbone. Each pair with distance < 8  is connected by a red link, and the more distant pairs are connected by the green links.
Fig. 2.
Fig. 2.
(A) Mean TP rate for 131 domain families, as a function of the number of top-ranked contacts and histogram of the distances of all predicted structures for each of the 131 domains studied. DI results (★) clearly outperform the other two methods: MI (red ●) and an approximate Bayesian approach (yellow ▾) developed by Burger and van Nimwegen (10). Their method aims at disentangling direct and indirect correlations by averaging over tree-shaped residue–residue coupling networks, and it contains a phylogeny correction. The method can also reach length-400 multiple alignments as mfDCA does; our implementation follows closely the description in ref. . However, coupling trees do not allow for multiple coupling paths between two residues as DCA does, possibly accounting for its lower TP rates compared to mfDCA. (B) The mfDCA predictions for the top 10, 20, and 30 residue pairs show a bimodal distribution of intradomain distances with two frequency peaks around 3–5 and 7–8 Å.
Fig. 3.
Fig. 3.
The only three long-distance high-DI predictions found out of the top 20 DI pairs in the Sigma54 interaction domain of protein NtrC1 of A. aeolicus (PDB ID 1NY6) out of the top 20 predicted couplets are multimerization contacts. Structures showing each of these three interdomain contacts which are separated by less than 5 Å in a ring-like heptamer formed by Sigma54 interaction domains. (A) Residue pair GLU(174)-ARG(253), (B) residue pair PHE(226)-TYR(261), and (C) residue pair ALA(197)-ALA(249). (D) Oligomerization contacts are found in 21 structures of the 131 families studied (see SI Appendix, Table S3). These contacts represent a significant percentage of long-distance high-DI contacts observed in our predictions.
Fig. 4.
Fig. 4.
The figures show the top 20 contacts predicted by DI for the family of response-regulator DNA-binding domain (GerE, PF00196) (containing both the dark- and light-blue colored regions). In A, the contacts are mapped to the DNA-binding domain of E. coli NarL, bound to the DNA target (PDB ID 1JE8). The TP rate for the top 20 DI pairs is 100%, and they are all shown as red links. In B, the contacts are mapped to the full-length response-regulator DosR of M. tuberculosis (PDB ID 3C3W), with the (unphosphorylated) response-regulator domain shown in gray. The top 20 DI pairings is only 65% in this case (13 red and 7 green links). The difference in prediction quality for the two structures can be traced back to a major reorientation of the C-terminal helix of the GerE domain (light blue) in B.
Fig. 5.
Fig. 5.
The metalloenzyme domain (PF00903) of protein FosA (PDB ID 1NKI) is an example of a case where long-distance high-DI pairs are in fact residue pairs coordinating a ligand. The high-DI pair involving the residues Glu110 (pink) and His7 (yellow) coordinate a metal ion Mn(II) (red) in its dimer configuration. K+ ions are shown as larger spheres (gray and blue), each coordinated by a monomer of the corresponding color.
Fig. 6.
Fig. 6.
Cumulative distribution of the number of acceptable pairs (NAPx) for a given TP rate x. The curves show the probability of NAPx to be larger than a given number n for contacts at given TP rates of 0.9, 0.8, and 0.7. The curves are computed for all 856 PDB structures in the dataset. We observe that the probability of NAP70 > 30 is 70% and NAP70 > 100 is 34%, which implies that a substantial number of protein domains can have accurate predictions that go beyond the top 30 DI pairings. We also identify some exceptional cases with NAP70 > 600.
Fig. 7.
Fig. 7.
Two examples of contact map predictions using MI (A and D) and mfDCA (B and E). Gray symbols represent the native map with a cutoff of 8 Å, colored symbols the computational contact predictions using MI or DI ranking (red squares for TP and green squares for spatially distant pairs). The number of pairs is determined such that there are 2L pairs with minimum separation five along the sequence, where L is the domain length. The right-most panels (C and F) bin the predictions of MI (blue) and mfDCA (red) according to their separation along the protein sequence. The overall bars count all predictions, the shaded part the TPs. Note in particular that mfDCA leads to a higher number of more accurate predictions for large separations. (AC) The promoter recognition helix domain of the SigmaE factor (PDB ID 1OR7). (DF) The eukaryotic signaling protein Ras (PDB ID 1P21). For better comparability of native vs. predicted contacts, the predictions are displayed only above the diagonal.
Fig. P1.
Fig. P1.
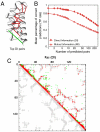
(A) Contact predictions for the Sigma-E factor of E. coli. Of the top 20 contact predictions, 19 pairs with distance < 8  are connected by red links, whereas the only more distant pair is shown in green, which represents a TP rate of 95%. (B) The TP rate averaged over 131 domain families shows a very gradual decline as a function of the number of predicted contacts. The mfDCA (diamonds) clearly outperforms simple correlation analysis using mutual information (open circles). (C) Contact map prediction for the eukaryotic signaling protein Ras. Gray symbols represent the native map (cutoff of 8 Å), shown in both the lower and upper triangles. The colored symbols in the upper triangle indicate the contacts predicted using mfDCA, with the red squares for the TPs (like the red links in A), and green squares for the false positives (like the green link in A).

References

    1. Altschuh D, Lesk A, Bloomer A, Klug A. Correlation of co-ordinated amino acid substitutions with function in viruses related to tobacco mosaic virus. J Mol Biol. 1987;193:693–707. - PubMed
    1. Göbel U, Sander C, Schneider R, Valencia A. Correlated mutations and residue contacts in proteins. Proteins Struct Funct Genet. 1994;18:309–317. - PubMed
    1. Neher E. How frequent are correlated changes in families of protein sequences? Proc Natl Acad Sci USA. 1994;91:98–102. - PMC - PubMed
    1. Shindyalov IN, Kolchanov NA, Sander C. Can three-dimensional contacts in protein structures be predicted by analysis of correlated mutations? Protein Eng. 1994;7:349–358. - PubMed
    1. Lockless SW, Ranganathan R. Evolutionarily conserved pathways of energetic connectivity in protein families. Science. 1999;286:295–299. - PubMed

Publication types