. 2012 Mar;22(3):467-77.
doi: 10.1101/gr.126417.111. Epub 2011 Nov 21.

Tissue type is a major modifier of the 5-hydroxymethylcytosine content of human genes

Affiliations

Tissue type is a major modifier of the 5-hydroxymethylcytosine content of human genes

Colm E Nestor et al. Genome Res. 2012 Mar.

Abstract

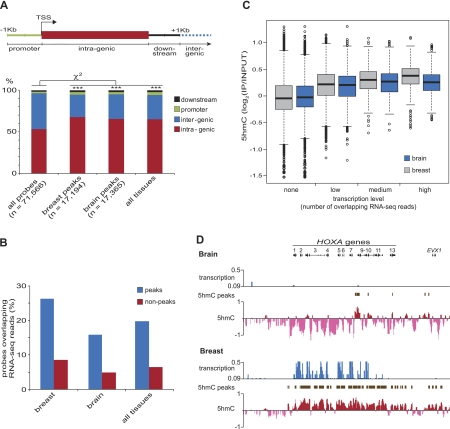
The discovery of substantial amounts of 5-hydroxymethylcytosine (5hmC), formed by the oxidation of 5-methylcytosine (5mC), in various mouse tissues and human embryonic stem (ES) cells has necessitated a reevaluation of our knowledge of 5mC/5hmC patterns and functions in mammalian cells. Here, we investigate the tissue specificity of both the global levels and locus-specific distribution of 5hmC in several human tissues and cell lines. We find that global 5hmC content of normal human tissues is highly variable, does not correlate with global 5mC content, and decreases rapidly as cells from normal tissue adapt to cell culture. Using tiling microarrays to map 5hmC levels in DNA from normal human tissues, we find that 5hmC patterns are tissue specific; unsupervised hierarchical clustering based solely on 5hmC patterns groups independent biological samples by tissue type. Moreover, in agreement with previous studies, we find 5hmC associated primarily, but not exclusively, with the body of transcribed genes, and that within these genes 5hmC levels are positively correlated with transcription levels. However, using quantitative 5hmC-qPCR, we find that the absolute levels of 5hmC for any given gene are primarily determined by tissue type, gene expression having a secondary influence on 5hmC levels. That is, a gene transcribed at a similar level in several different tissues may have vastly different levels of 5hmC (>20-fold) dependent on tissue type. Our findings highlight tissue type as a major modifier of 5hmC levels in expressed genes and emphasize the importance of using quantitative analyses in the study of 5hmC levels.


Figures

Figure 1.
Figure 1.
Marked inter-tissue differences in global 5hmC levels. (A) Dot-blots of decreasing amounts of a PCR product of the mouse Tex19 promoter sequence in which all cytosines are either unmodified (C), methylated (5mC), or hydroxymethylated (5hmC), were probed with α-5hmC and α-5mC antibodies. The α-5hmC and α-5mC antibodies are specific for their respective marks. (B) Duplicate dot-blots of DNA from human tissues and ES cells probed with antibodies specific to 5hmC or 5mC show that global 5hmC levels vary markedly between normal human tissues. An α-ssDNA antibody was used to control for loading; 500 ng and 100 ng were loaded in the upper and lower lanes, respectively. Ten nanograms of amplified mouse Tex19.1 promoter was used as a control; (solid circle) unmethylated DNA; (dotted circle) methylated DNA; (dashed circle) hydroxymethylated DNA. (C) Inter-tissue differences in global 5hmC levels as determined by densitometric analysis of dot-blots shown in panel B. 5hmC values were normalized to an ssDNA loading control and scaled relative to brain. Values are the means of two independent biological replicates. Spleen and ES values represent single measurements. (D) A scatterplot showing a lack of correlation between global 5mC and 5hmC values for seven samples. 5mC values were obtained from previously published HPLC analyses of global 5mC content in human tissues (Ehrlich et al. 1982; Weisenberger et al. 2005). (E) Duplicate dot-blots of DNA from mouse tissues and ES cells probed with antibodies specific to 5hmC or 5mC show that global 5hmC levels vary markedly between normal mouse tissues. An α-ssDNA antibody was used to control for loading. Ten nanograms of amplified mouse Tex19.1 promoter was used as a control; (solid circle) unmethylated DNA; (dotted circle) methylated DNA; (dashed circle) hydroxymethylated DNA.
Figure 2.
Figure 2.
Reduced global 5hmC levels and TET1/2/3 gene expression in human cell lines. (A) Duplicate dot-blots of DNA (500 ng) from normal human breast tissue, a primary mammary epithelial cell line from non-cancerous tissue, and eight breast cancer cell lines probed with antibodies specific to 5hmC or ssDNA illustrate that global 5hmC levels are reduced in the DNA of primary and cancer cell lines relative to normal breast. (B) Inter-sample differences in global 5hmC levels by densitometric analysis of dot-blots shown in panel A. 5hmC values were normalized to the ssDNA loading control and scaled relative to normal breast DNA. Values are the means of two technical replicates. (C) RT-qPCR analysis of expression levels of TET1, TET2, and TET3 in normal human breast tissue, a primary mammary epithelial cell line, and eight breast cancer cell lines. Expression levels were normalized to GAPDH expression, and expression levels in normal human breast set to 1. Error bars represent the SD of two technical replicates. (D) Duplicate dot-blots of DNA (500 ng) from normal human colon and liver tissue and six cancer cell lines probed with antibodies specific to 5hmC or ssDNA illustrate that global 5hmC levels are also reduced in the DNA of colon and liver cancer cell lines relative to normal tissue. (E) Duplicate dot-blots of DNA (500 ng) from normal human breast tissue, and the primary mammary epithelial cell line derived from that tissue probed with antibodies specific to 5hmC, 5mC, or ssDNA show that global levels of 5hmC, but not 5mC, are gradually reduced upon transformation of normal breast tissue to cell culture. Ten nanograms of amplified mouse Tex19.1 promoter in which all cytosines were either unmodified (C), methylated (mC), or hydroxymethylated (hmC), was used as a control.
Figure 3.
Figure 3.
Genomic patterns of 5hmC enrichment are tissue-specific. (A) Shown are the patterns of 5hmC enrichment [log2(input/IP)] across the HOXA cluster for multiple replicates of multiple tissues. (B) A dendrogram derived from unsupervised hierarchical consensus clustering of 14 human DNA samples based on 5hmC enrichment levels for all 72,000 probes on each tiling microarray. Samples cluster by tissue type. AU (approximately unbiased) P-value of robustness of each cluster; (**) P > 0.01; (***) P > 0.001.
Figure 4.
Figure 4.
5hmC is enriched in transcribed regions. (A) Diagram illustrating the defined genomic regions that are assayed for %5hmC enrichment. All probes found within peaks of 5hmC enrichment were classified according to their genic location. The bar chart below illustrates that probes within peaks of 5hmC (“peak-probes”) are enriched in intragenic regions in brain and breast tissues. See text for definition of 5hmC peaks. (B) Bar chart illustrating that the peak-probes associate with regions of active transcription in brain and breast. The percentage of probes overlapping RNA-sequencing reads for each tissue is shown. (C) Box plot showing that 5hmC levels increase with steady-state transcript levels. Each probe was classified according to its number of overlapping RNA-sequencing reads for brain and breast; none = 0, low = 1, medium = 1–5, high > 5. (D) The presence of 5hmC is associated with transcription. The HOXA cluster is transcribed and marked with 5hmC in breast, whereas transcription and 5hmC appear absent in brain. Schematic representation of both the 5hmC and RNA-sequencing profile of the HOXA cluster is shown; the figure is adapted from the UCSC Genome Browser. Transcription values are given in reads per million (RPM).
Figure 5.
Figure 5.
Tissue type is a major modifier of 5hmC levels in genes. (A) Unsupervised hierarchical clustering of 12 loci by absolute 5hmC levels results in two groups containing high (HIGH) and low (LOW) levels of 5hmC, respectively, for each indicated tissue. (Red boxes) H19/IGF2 loci; (blue boxes) HOXA loci. (B) Box-plot of 5hmC (%) levels of all five loci in the HIGH cluster for each tissue shows that the range of 5hmC levels at HIGH loci varies markedly between tissues. (C) The relative global 5hmC content (Fig. 1C) correlates with average 5hmC (%) content of each tissue as determined by 5hmC-qPCR. (D) Inter-tissue differences in 5hmC levels do not correlate with inter-tissue expression levels. Average 5hmC (%) content of genic loci of H19 (upper panel) and IGF2 (lower panel) in each indicated tissue is plotted against expression of probes (H19 = 1 probe; IGF2 = 2 probes) for each gene obtained from the GNF expression database. The GNF expression database does not contain data for breast.

Similar articles

Cited by

References

    1. Aflatoonian B, Ruban L, Shamsuddin S, Baker D, Andrews P, Moore H 2010. Generation of Sheffield (Shef) human embryonic stem cell lines using a microdrop culture system. In Vitro Cell Dev Biol Anim 46: 236–241 - PubMed
    1. Bird A 2002. DNA methylation patterns and epigenetic memory. Genes Dev 16: 6–21 - PubMed
    1. Borgel J, Guibert S, Li Y, Chiba H, Schubeler D, Sasaki H, Forne T, Weber M 2010. Targets and dynamics of promoter DNA methylation during early mouse development. Nat Genet 42: 1093–1100 - PubMed
    1. Chen DT, Nasir A, Culhane A, Venkataramu C, Fulp W, Rubio R, Wang T, Agrawal D, McCarthy SM, Gruidl M, et al. 2010. Proliferative genes dominate malignancy-risk gene signature in histologically-normal breast tissue. Breast Cancer Res Treat 119: 335–346 - PMC - PubMed
    1. Cleveland W 1979. Robust locally weighted regression and smoothing scatterplots. J Am Stat Assoc 74: 829–836

Publication types

MeSH terms

Associated data