. 2012 Jul 20;21(11):1936-47.
doi: 10.1089/scd.2011.0422. Epub 2012 Feb 7.

The transcription factor DLX3 regulates the osteogenic differentiation of human dental follicle precursor cells

Affiliations

The transcription factor DLX3 regulates the osteogenic differentiation of human dental follicle precursor cells

Sandra Viale-Bouroncle et al. Stem Cells Dev. .

Abstract

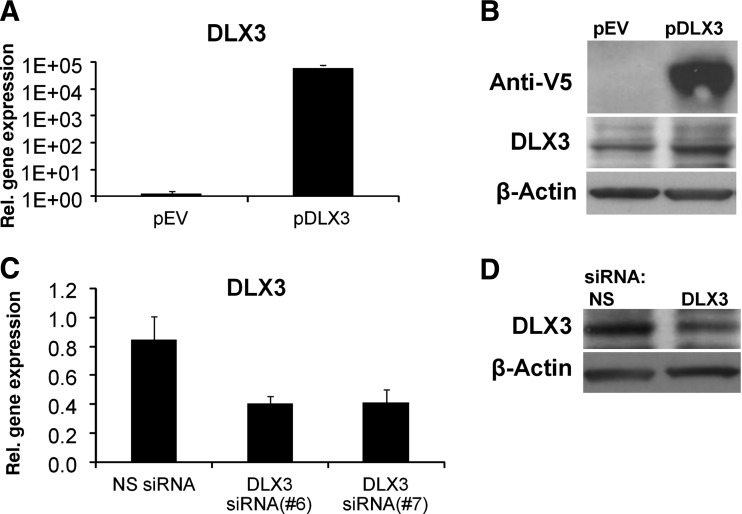
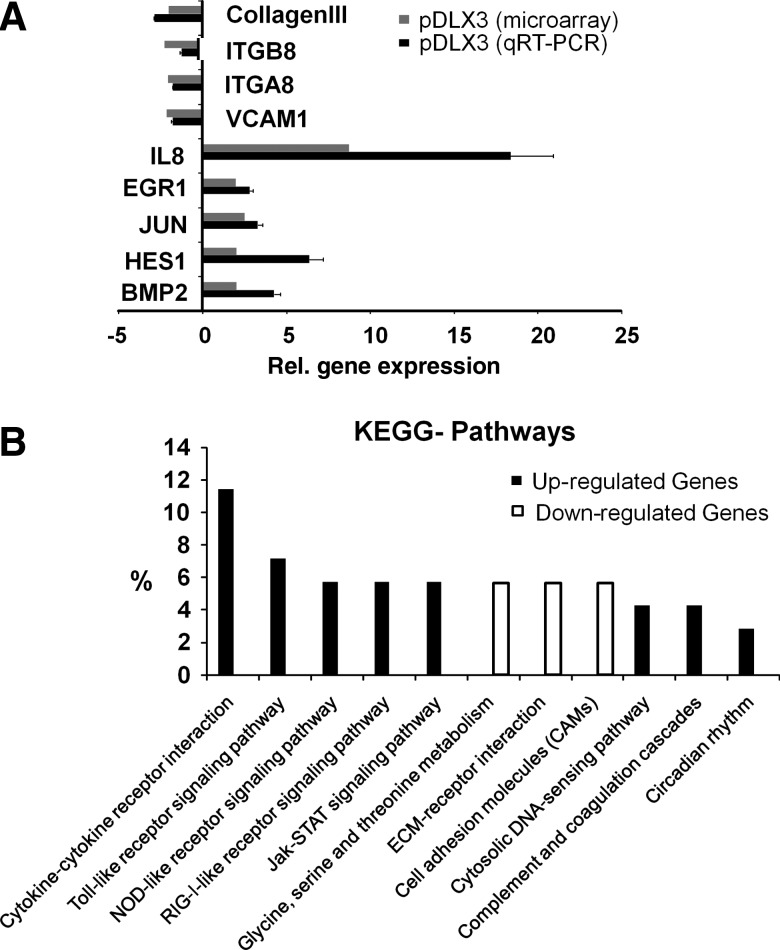
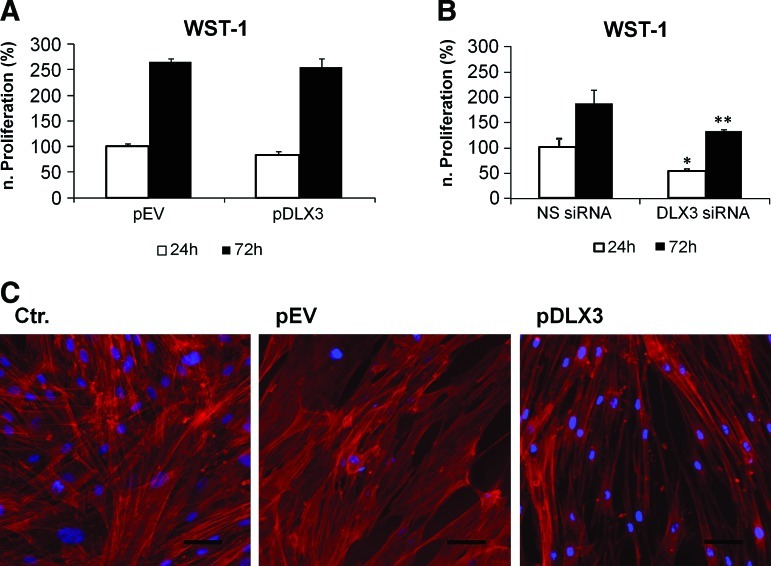
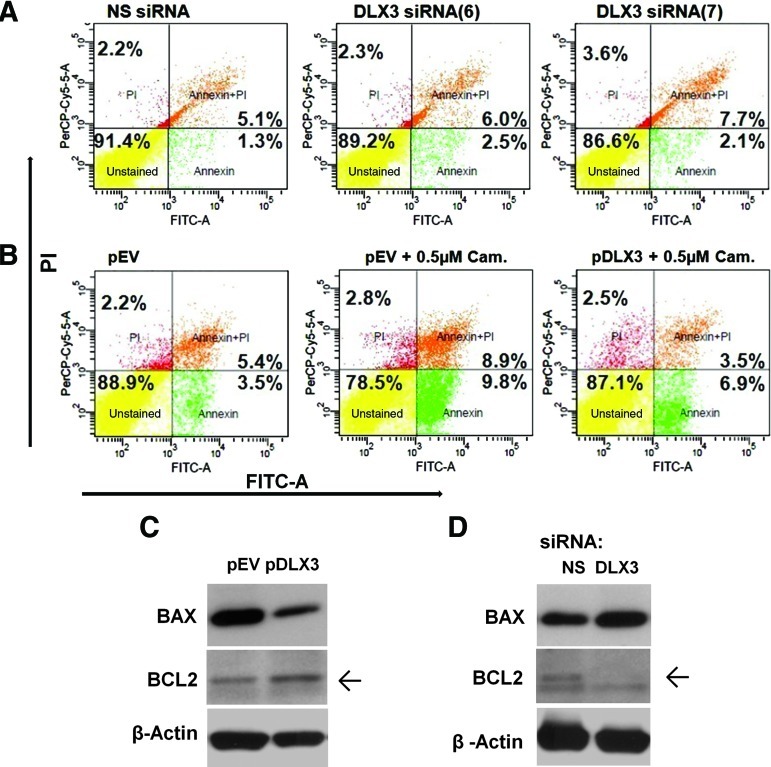
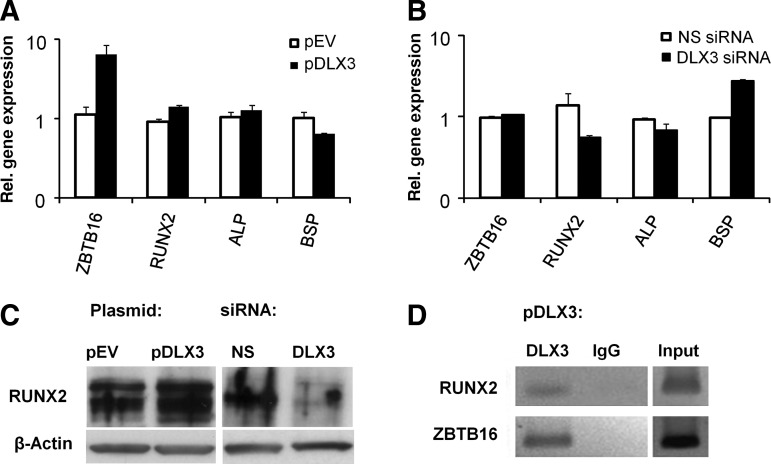
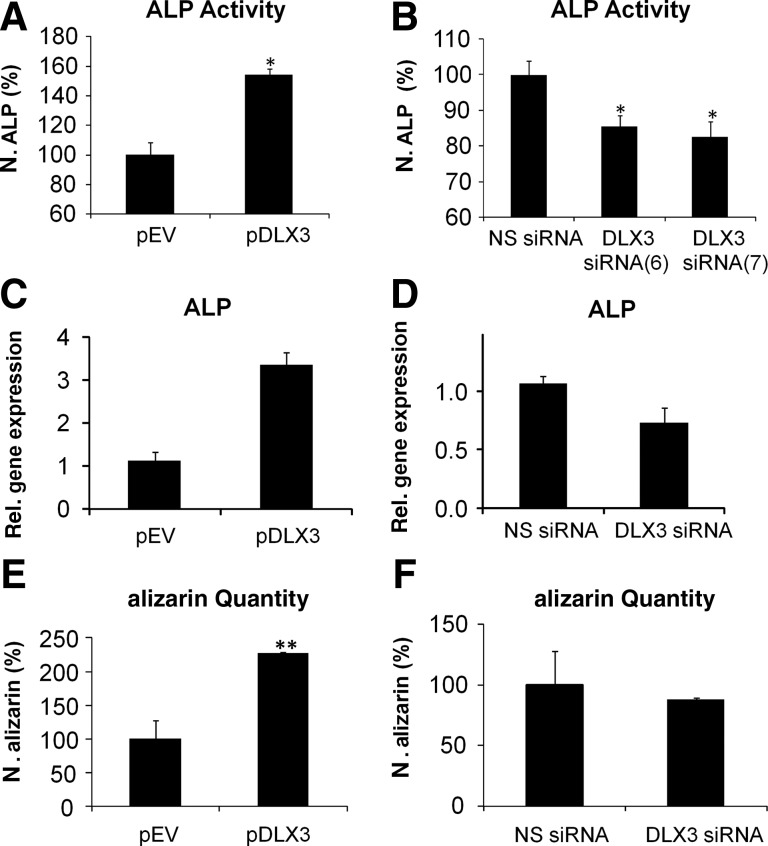
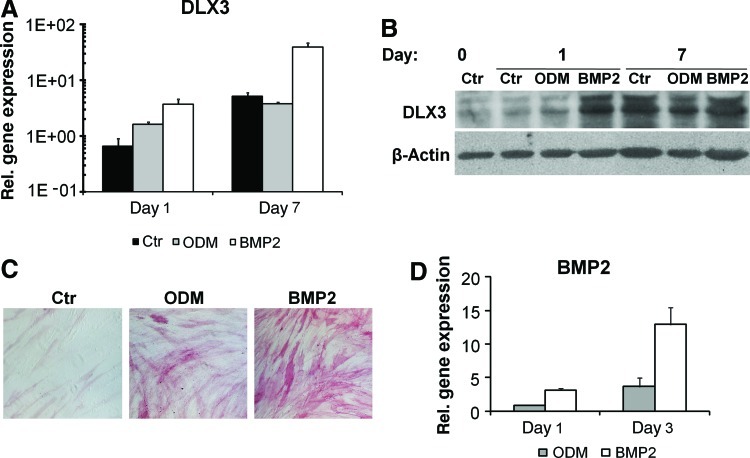
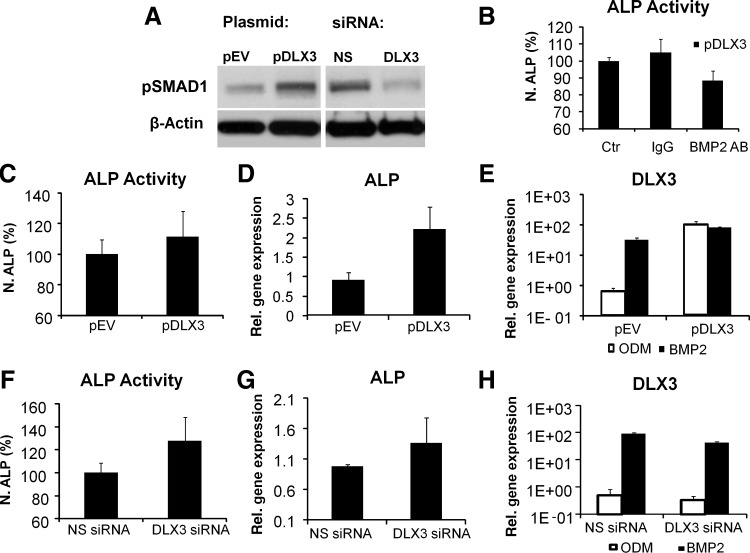
The transcription factor DLX3 plays a decisive role in bone development of vertebrates. In neural-crest derived stem cells from the dental follicle (DFCs), DLX3 is differentially expressed during osteogenic differentiation, while other osteogenic transcription factors such as DLX5 or RUNX2 are not highly induced. DLX3 has therefore a decisive role in the differentiation of DFCs, but its actual biological effects and regulation are unknown. This study investigated the DLX3-regulated processes in DFCs. After DLX3 overexpression, DFCs acquired a spindle-like cell shape with reorganized actin filaments. Here, marker genes for cell morphology, proliferation, apoptosis, and osteogenic differentiation were significantly regulated as shown in a microarray analysis. Further experiments showed that DFCs viability is directly influenced by the expression of DLX3, for example, the amount of apoptotic cells was increased after DLX3 silencing. This transcription factor stimulates the osteogenic differentiation of DFCs and regulates the BMP/SMAD1-pathway. Interestingly, BMP2 did highly induce DLX3 and reverse the inhibitory effect of DLX3 silencing in osteogenic differentiation. However, after DLX3 overexpression in DFCs, a BMP2 supplementation did not improve the expression of DLX3 and the osteogenic differentiation. In conclusion, DLX3 influences cell viability and regulates osteogenic differentiation of DFCs via a BMP2-dependent pathway and a feedback control.


Figures

FIG. 1.
FIG. 1.
DLX3 overexpression or DLX3 silencing in dental follicle stem cells (DFCs). The gene expression of DLX3 was determined by quantitative reverse- transcription polymerase chain reaction (qRT-PCR) analysis after 48 h of transfection with the expression plasmid (pDLX3) and the empty vector (pEV) (A) or with two independently DLX3-specific small interfering RNA (siRNA), siRNA(6) and siRNA(7), and a nonspecific siRNA, NS siRNA (C). All values are means plus standard error (σ/√n) of three biological replicates (n=3) per group. Gene expression of DFCs after transfection with pDLX3 or DLX3 siRNA was compared with the control groups pEV or NS siRNA, respectively. DLX3 expression were also verified at protein level by western blotting (B,D); recombinant DLX3 was detected with an epitop-V5 specific antibody and the total DLX3 protein was detected with a specific antibody DLX3. The β-Actin antibody was used as a housekeeper standard. Protein lysates after 72 h of transfection (for details, see Materials and Methods) were used for western blot analysis.
FIG. 2.
FIG. 2.
Microarray analysis after DLX3 overexpression in DFCs. (A) The real-time RT-PCRs confirmed regulated gene expression of selected genes of the DNA microarray analysis. Gray bars represent the mean of gene expression measured by Affymetrix microarray analysis and the black bars of qRT-PCRs. Total RNAs from DFCs transfected with pEV were used for calibration of real-time RT-PCRs (relative gene expression=0). Primers listed in table 1a. (B) Comparative Kyoto encyclopedia of genes and genomes (KEGG) pathway analysis of Affymetrix microarray expression signals from DFCs after DLX3 overexpression (48h). KEGG pathway analysis (p values <0.05: strongly enriched in the annotation categories) of up-regulated genes (black bars) and down-regulated genes (white bars).
FIG. 3.
FIG. 3.
Influence of DLX3 on proliferation and morphology of DFCs. For evaluation of cell proliferation, the metabolic activity of DFCs was measured with WST-1 after 24 h and 72 h of transfection (A, B). The proliferation was not influenced by DLX3 overexpression (A), but decreased after DLX3 silencing (B). All values are means plus standard error (σ/√n) of 4 biological replicates. DFCs after DLX3 overexpression and silencing were compared with controls after 24 h and 72 h. Statistics were done using the Student's t test. *p<0.05 t test, **p<0.005. (C) Cell morphology changes of DFCs after DLX3 overexpression was visualized by staining of actin filaments and the cell nucleus (for details see Materials and Methods). Standard bars: 50 μm. Color images available online at www.liebertonline.com/scd
FIG. 4.
FIG. 4.
Apoptosis of DFCs. FACS analysis after transfection with (A) DLX3 specific siRNAs (6 and 7) and a NS siRNA, or (B) with pDLX3 and pEV in DFCs after treatment with Camptothecin. For visualization of cell viability the Annexin V/PI assay was applied. Viable cells (annexin V; PI) are shown in the lower left quadrant of density plots. Apoptotic cells (annexin V+; PI) are shown in the lower right quadrant. Cells in the late apoptosis (annexin V+; PI+) are shown in the upper right quadrant and necrotic cells (annexin V; PI+) are in the upper left quadrant. Western blot analysis with BAX, BCL2, and β-Actin antibodies and protein lysates of DFCs, 72 h after transfection with (C) pDLX3 and pEV or (D) DLX3 siRNA(6) and NS siRNA on basal medium. Color images available online at www.liebertonline.com/scd
FIG. 5.
FIG. 5.
DLX3 directly regulates expression of osteogenic markers in DFCs. Relative gene expression of ostegenic markers in DFCs was determined 48 h after transfection with (A) pDLX3 and pEV or (B) DLX3 siRNA(6) and NS siRNA by real-time PCR analysis. Sequences for primers and probes are listed in Table 1A. The gene expression of DFCs transfected with the respective controls (pEV or NS siRNA) was used for calibration. All values are means plus standard error (σ/√n) of 3 biological replicates. (C) Western blot analyses were done with RUNX2 and β-Actin specific antibodies and protein lysates of DFCs, 72 h after transfection with pDLX3 and pEV or DLX3 siRNA and NS siRNA in basal medium. (D) Chromatin immunoprecipitation analysis with DFCs (after DLX3 transfection) cultivated 72 h in basal medium, Dulbecco's modified Eagle's medium. The precipitations were done with either a DLX3 specific antibody or an unspecific antibody (immunoglobulin G, IgG) for control. PCRs for DLX3-binding sites on promoters of the genes RUNX2 and ZBTB16 were made with precipitated genomic DNA. ZBTB16, zinc finger and BTB domain containing 16; RUNX2, runt-related transcription factor 2; ALP, alkaline phosphatase; BSP, bone sialoprotein.
FIG. 6.
FIG. 6.
Influence of DLX3 on osteogenic differentiation of DFCs. The differentiation was evaluated by measurement of the ALP activity (A, B). ALP activity was quantified in DFCs 10 days after induction with osteogenic differentiation medium (ODM) and transfection with (A) pDLX3 and pEV or (B) DLX3 specific siRNAs (6 and 7). ALP activities were calibrated to the activity of the respective control cultures, pEV or NS siRNA, with ODM. All values are means plus standard error (σ/√n) of 4 biological replicates per group. Significant differences are shown with the Student's t test (n=4; *P<0.05). Relative gene expression of ALP was determined 3 days after induction with ODM and transfection with (C) pDLX3 and pEV or a (D) DLX3 specific siRNA(6). Mineral deposits in DFC cultures were estimated with alizarin red staining after 28 days of culture with ODM and transfection with (E) pDLX3 and pEV or (F) DLX3 siRNA(6) and NS siRNA. Quantification of alizarin staining was normalized to the respective controls, pEV or NS siRNA, cultivated in ODM. All values are means plus standard error (σ/√n) of 3 biological replicates per group. Significant differences are shown with the Student's t test (**: p<0.005).
FIG. 7.
FIG. 7.
DLX3 expression during osteogenic differentiation in DFCs. (A, B) DLX3 expression after 1 and 7 days of induction with either ODM or BMP2. (A) The relative gene expression of DLX3 was determined by qRT-PCR analysis and calibrated to the gene expression of control cells (Ctr) before differentiation. All values are means plus standard error (σ/√n) of 3 biological replicates. (B) Western blot analysis with DLX3 and β-Actin specific antibodies and protein lysates of DFCs cultivated in DMEM (Ctr) before (day 0) and after 1 and 7 days of osteogenic differentiation in ODM or BMP2. (C) ALP activity staining in DFCs after 10 days of induction with ODM or BMP2 and without induction (Ctr, basal medium). All figures have the same magnification. (D) BMP2 expression after 1 and 3 days of induction with either ODM or BMP2. All values are means plus standard error (σ/√n) of 3 biological replicates. Color images available online at www.liebertonline.com/scd
FIG. 8.
FIG. 8.
Relation between DLX3 and BMP2 expression during osteogenic differentiation in DFCs. (A) Western Blot analysis with pSMAD1 and β-Actin specific antibodies and protein lysates of DFCs, 72 h after transfection with either pDLX3 or DLX3 siRNA in basal medium. (B) ALP activity (day 10 of differentiation in ODM) in DFCs after DLX3 overexpression and selectively inhibition of the BMP-2 pathway with a specific anti-BMP2 neutralizing antibody. The effect was compared with DLX3- transfected DFCs in ODM and an unspecific antibody (IgG) and with DLX3-transfected DFCs in ODM (Ctr.) without antibody treatment. Results are relative ALP activities to the mean activity of the control culture. All values are means plus standard error (σ/√n) of 4 biological replicates per group. (C, F) The ALP activity was quantified in DFCs after 10 days of BMP2 induction and after transfection with either pDLX3 (C) or DLX3 siRNA(6) (F). All values are means plus standard error (σ/√n) of 3 biological replicates per group; the differences were not significant. Relative gene expression of ALP was determined 3 days after induction with BMP2 and transfection with (D) pDLX3 and pEV or a (G) DLX3 specific siRNA(6). DLX3 expression was determined in DFCs after 3 days osteogenic differentiation, induced with BMP2 or ODM, and transfection with pDLX3 and pEV (E) or DLX3 siRNA(6) and NS siRNA (H). All values are means plus standard error (σ/√n) of 3 biological replicates.

Similar articles

Cited by

References

    1. Ten Cate AR. The development of the periodontium: a largely ectomesenchymally derived unit. Periodontol 2000. 1997;13:9–19. - PubMed
    1. Morsczeck C. Gotz W. Schierholz J. Zeilhofer F. Kuhn U. Mohl C. Sippel C. Hoffmann KH. Isolation of precursor cells (PCs) from human dental follicle of wisdom teeth. Matrix Biol. 2005;24:155–165. - PubMed
    1. Völlner F. Ernst W. Driemel O. Morsczeck C. A two-step strategy for neuronal differentiation in vitro of human dental follicle cells. Differentiation. 2009;77:433–441. - PubMed
    1. Kemoun P. Laurencin-Dalicieux S. Rue J. Farges JC. Gennero I. Conte-Auriol F. Briand-Mesange F. Gadelorge M. Arzate H. Narayanan AS. Brunel G. Salles JP. Human dental follicle cells acquire cementoblast features under stimulation by BMP-2/-7 and enamel matrix derivatives (EMD) in vitro. Cell Tissue Res. 2007;329:283–294. - PubMed
    1. Thesleff I. Mikkola M. The role of growth factors in tooth development. Int Rev Cytol. 2002;217:93–135. - PubMed

Publication types

MeSH terms