. 2012 Jan 11;134(1):130-3.
doi: 10.1021/ja209533x. Epub 2011 Dec 15.

Second-chance forward isomerization dynamics of the red/green cyanobacteriochrome NpR6012g4 from Nostoc punctiforme

Affiliations

Second-chance forward isomerization dynamics of the red/green cyanobacteriochrome NpR6012g4 from Nostoc punctiforme

Peter W Kim et al. J Am Chem Soc. .

Abstract

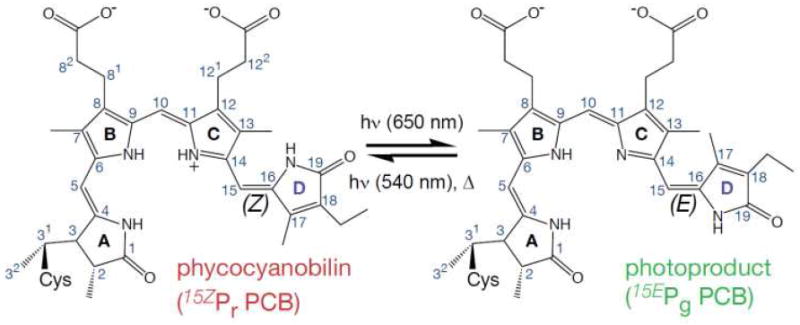
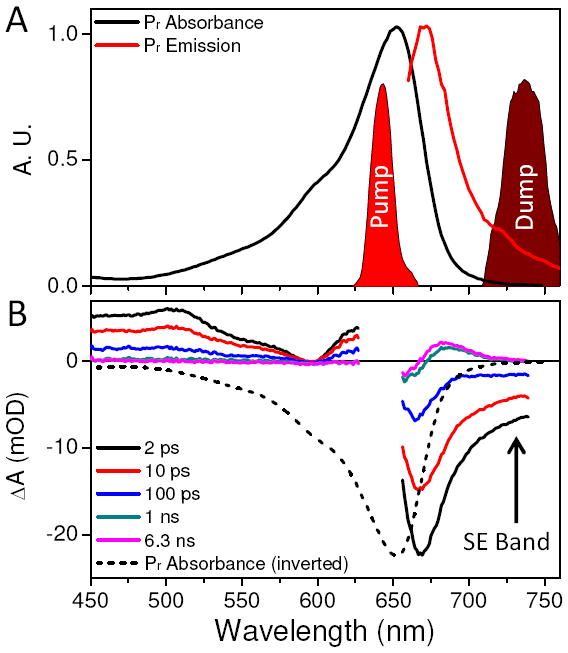
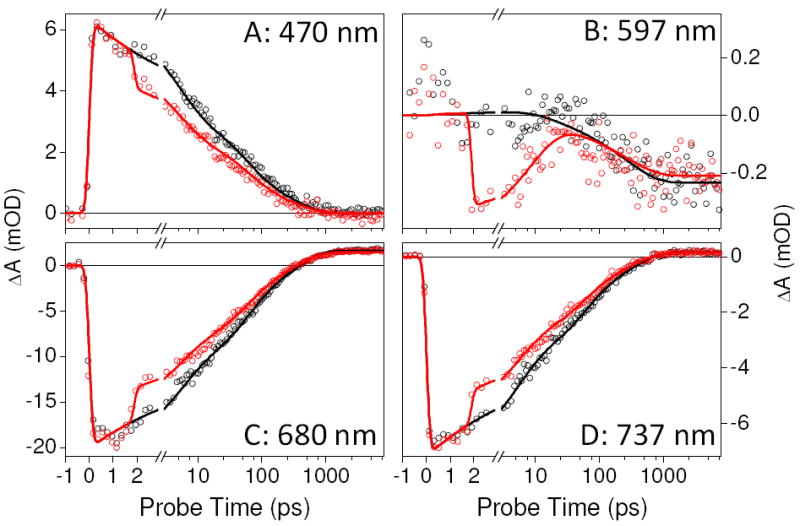
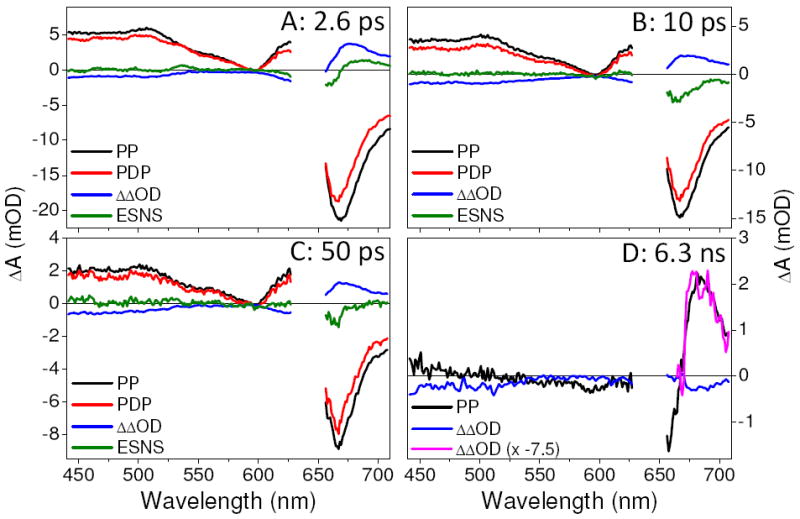
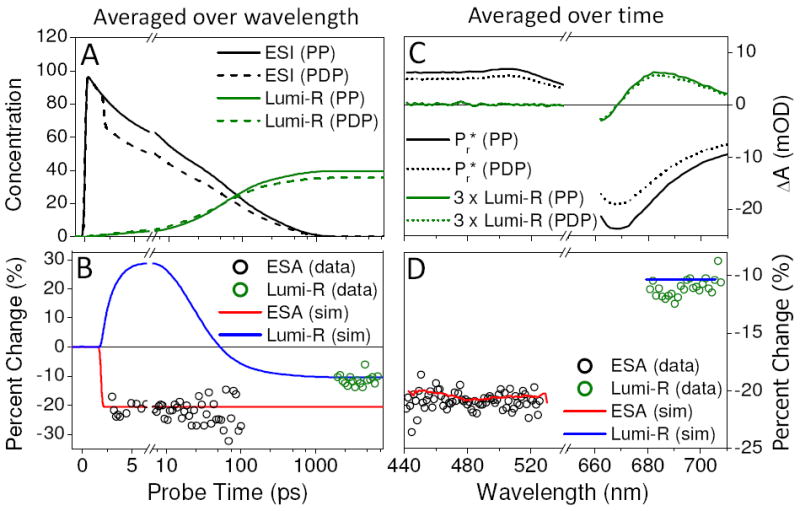
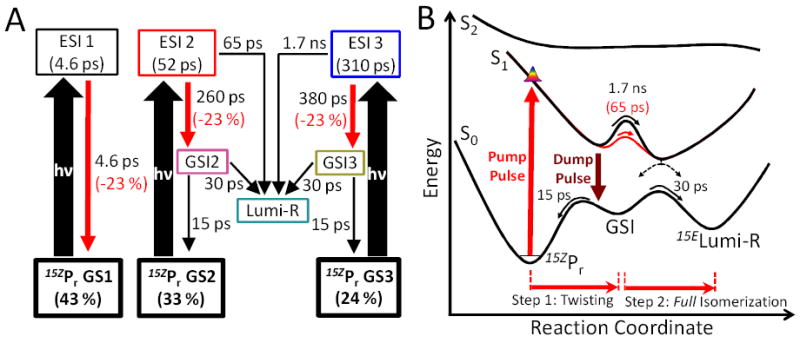
The primary ultrafast Z-to-E isomerization photodynamics of the phytochrome-related cyanobacteriochrome NpR6012g4 from Nostoc punctiforme was studied by transient absorption pump-dump-probe spectroscopy. A 2 ps dump pulse resonant with the stimulated emission band depleted 21% of the excited-state population, while the initial photoproduct Lumi-R was depleted by only 11%. We observed a red-shifted ground-state intermediate (GSI) that we assign to a metastable state that failed to isomerize fully. Multicomponent global analysis implicates the generation of additional Lumi-R from the GSI via crossing over the ground-state thermal barrier for full isomerization, explaining the discrepancy between excited-state and Lumi-R depletion by the dump pulse. This second-chance ground-state dynamics provides a plausible explanation for the unusually high quantum yield of 40% for the primary isomerization step in the forward reaction of NpR6012g4.


Figures

Figure 1
Figure 1
Phycocyanobilin (PCB) chromophore and NpR6012g4’s photochemistry. Pr is the dark-stable state with 15Z conformation, which isomerizes via C15,16-double bond to the higher energy 15E conformer Pg that can convert back to Pr photochemically or thermally.
Figure 2
Figure 2
(A) Pr ground-state spectrum (black line) and fluorescence emission band (red line) overlaid with spectra of pump (630 nm) and dump (740 nm) pulses. (B) Transient spectra of pump-probe data at selected probe times. The SE of the 2-ps transient spectrum overlaps the dump pulse spectrum. Inverted Pr absorption (black dashes) is shown for comparison.
Figure 3
Figure 3
Select kinetic traces of PP (black circle) and PDP (red circle) at wavelengths indicated. Both PP and PDP data are fitted with a kinetic model (solid lines) described in the Supporting Information (Fig. S4).
Figure 4
Figure 4
Transient spectra of PP (black), PDP (red), and ΔΔOD (blue) at indicated probe times. The green line is ESNS, the difference spectrum between the PP and the PDP spectra normalized to the PP ESA band at 500 nm. At 2.6 ps, there is positive absorption red-shifted from Pr, indicating the formation of a GSI. The 6.3-ns spectrum shows dump-induced Lumi-R depletion indicated by decrease of the Lumi-R absorption amplitude. The 6.3-ns ΔΔOD is inverted, magnified (pink) and overlaid on the PP data.
Figure 5
Figure 5
Comparison of the average percent change of initial Pr* and final Lumi-R populations induced by the dump pulse. Percent change is calculated by (PP-PDP)/PP × 100 %. The simulation is based on the kinetic model in Figure 6A. Panels A and B are averaged over wavelengths: 440 to 525 nm and 680 to 705 nm for Pr* and Lumi-R, respectively. Panels C and D are averaged over time: 3 to 100 ps and 2 to 7 ns for Pr* and Lumi-R, respectively. (A) Simulated concentration profiles of Pr* (ESI1 + ESI2 + ESI3) and Lumi-R for both PP and PDP conditions. (B) Comparison between simulated Pr* and Lumi-R percent change (lines) and experimental percent change (circles) averaged over wavelengths. (C) PP and PDP spectra of Pr* and Lumi-R for reference. (D) Comparison between simulated (lines) and experimental (circles) Pr* and Lumi-R percent change averaged over time.
Figure 6
Figure 6
(A) Kinetic model of NpR6012g4 forward reaction based on PDP data. (B) Potential Energy Surface- of the forward reaction based on target model in Panel A. Only the productive pathway from ESI 2 (potential barrier and time constant in red on S1 potential surface) and ESI 3 (all black)are described here.

References

    1. Rockwell NC, Su YS, Lagarias JC. Annual Review of Plant Biology. 2006;57:837. - PMC - PubMed
    1. Auldridge ME, Forest KT. Critical Reviews in Biochemistry and Molecular Biology. 2011;46:67. - PubMed
    1. Franklin KA, Quail PH. Journal of Experimental Botany. 2010;61:11. - PMC - PubMed
    1. Ikeuchi M, Ishizuka T. Photochemical & Photobiological Sciences. 2008;7:1159. - PubMed
    1. Rockwell NC, Lagarias JC. Chemphyschem. 2010;11:1172. - PMC - PubMed

Publication types

Substances