

The use of a DNA biobank linked to electronic medical records to characterize pharmacogenomic predictors of tacrolimus dose requirement in kidney transplant recipients
- PMID: 22108237
- PMCID: PMC3237759
- DOI: 10.1097/FPC.0b013e32834e1641
The use of a DNA biobank linked to electronic medical records to characterize pharmacogenomic predictors of tacrolimus dose requirement in kidney transplant recipients
Abstract
Objective: Tacrolimus, an immunosuppressive drug widely prescribed in kidney transplantation, requires therapeutic drug monitoring due to its marked interindividual pharmacokinetic variability and narrow therapeutic index. Previous studies have established that CYP3A5 rs776746 is associated with tacrolimus clearance, blood concentration, and dose requirement. The importance of other drug absorption, distribution, metabolism, and elimination (ADME) gene variants has not been well characterized.
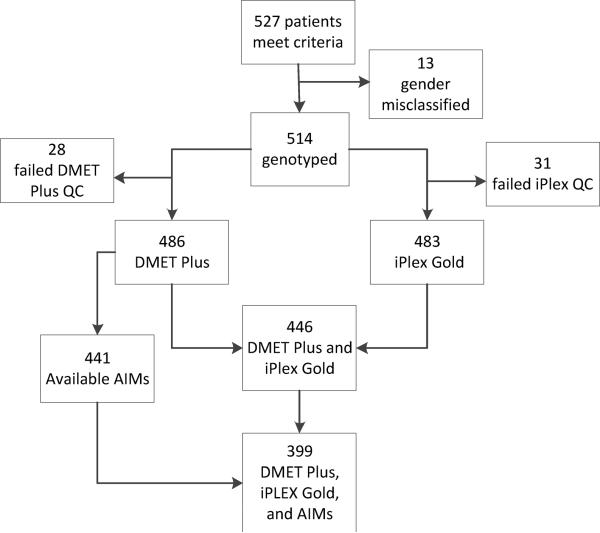
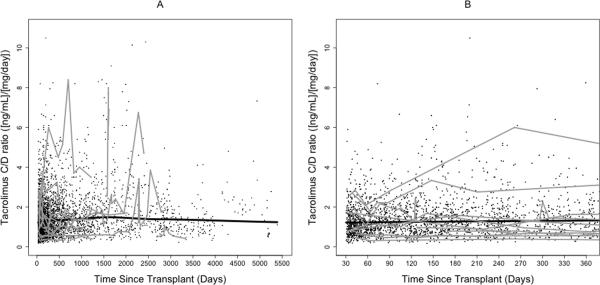
Methods: We used novel DNA biobank and electronic medical record resources to identify ADME variants associated with tacrolimus dose requirement. Broad ADME genotyping was performed on 446 kidney transplant recipients, who had been dosed to a steady state with tacrolimus. The cohort was obtained from Vanderbilt's DNA biobank, BioVU, which contains linked deidentified electronic medical record data. Genotyping included Affymetrix drug-metabolizing enzymes and transporters Plus (1936 polymorphisms), custom Sequenom Massarray iPLEX Gold assay (95 polymorphisms), and ancestry-informative markers. The primary outcome was tacrolimus dose requirement defined as blood concentration to dose ratio.
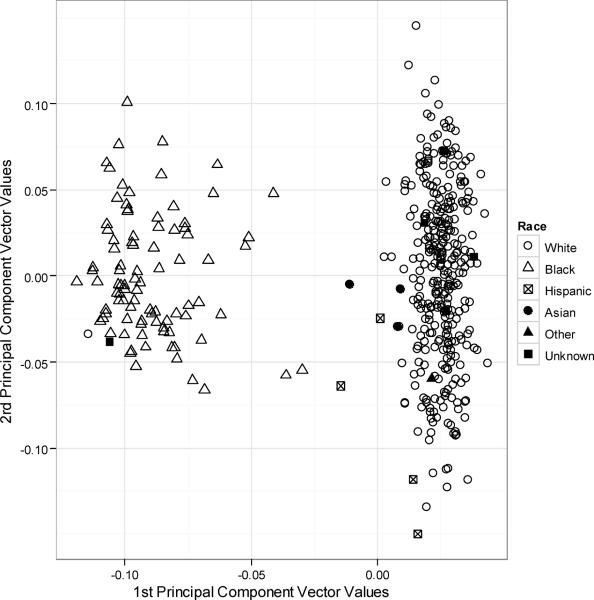
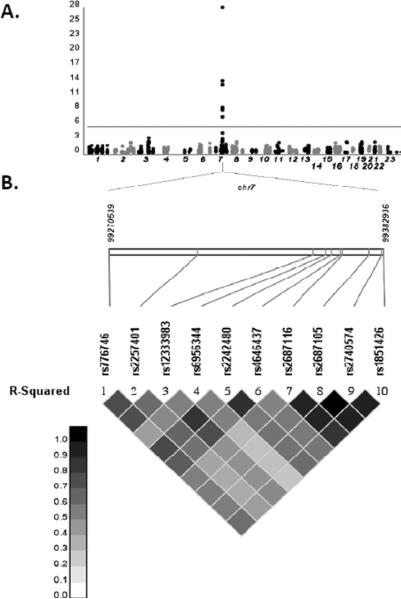
Results: In analyses, which adjusted for race and other clinical factors, we replicated the association of tacrolimus blood concentration to dose ratio with CYP3A5 rs776746 (P=7.15×10), and identified associations with nine variants in linkage disequilibrium with rs776746, including eight CYP3A4 variants. No NR1I2 variants were significantly associated. Age, weight, and hemoglobin were also significantly associated with the outcome. In final models, rs776746 explained 39% of variability in dose requirement and 46% was explained by the model containing clinical covariates.
Conclusion: This study highlights the utility of DNA biobanks and electronic medical records for tacrolimus pharmacogenomic research.
Figures
References
-
- Collins AJ, Foley RN, Herzog C, Chavers B, Gilbertson D, Ishani A, et al. United States Renal Data System 2008 Annual Data Report. Am J Kidney Dis. 2009;53:S1–374. - PubMed
-
- Staatz CE, Tett SE. Clinical pharmacokinetics and pharmacodynamics of tacrolimus in solid organ transplantation. Clin Pharmacokinet. 2004;43:623–653. - PubMed
-
- Venkataramanan R, Swaminathan A, Prasad T, Jain A, Zuckerman S, Warty V, et al. Clinical pharmacokinetics of tacrolimus. Clin Pharmacokinet. 1995;29:404–430. - PubMed
-
- Tsunoda SM, Aweeka FT. The use of therapeutic drug monitoring to optimise immunosuppressive therapy. Clin Pharmacokinet. 1996;30:107–140. - PubMed
-
- Wallemacq P, Armstrong VW, Brunet M, Haufroid V, Holt DW, Johnston A, et al. Opportunities to optimize tacrolimus therapy in solid organ transplantation: report of the European consensus conference. Ther Drug Monit. 2009;31:139–152. - PubMed
Publication types
MeSH terms
Substances
Grants and funding
- R21 AG034412/AG/NIA NIH HHS/United States
- R01 AI077505/AI/NIAID NIH HHS/United States
- P30 EY08126/EY/NEI NIH HHS/United States
- P30 CA68485/CA/NCI NIH HHS/United States
- P30 DK058404/DK/NIDDK NIH HHS/United States
- TL1 RR024978/RR/NCRR NIH HHS/United States
- KL2 RR024977/RR/NCRR NIH HHS/United States
- P30 EY008126/EY/NEI NIH HHS/United States
- RC2 GM092618/GM/NIGMS NIH HHS/United States
- P30 CA068485/CA/NCI NIH HHS/United States
- 1UL1RR024975-01/RR/NCRR NIH HHS/United States
- UL1 RR024975/RR/NCRR NIH HHS/United States
- P30 DK58404/DK/NIDDK NIH HHS/United States
- K23 GM100183/GM/NIGMS NIH HHS/United States
- T32 GM080178/GM/NIGMS NIH HHS/United States
LinkOut - more resources
Full Text Sources
Other Literature Sources
Medical
Molecular Biology Databases
