. 2012 Jan;158(1):95-106.
doi: 10.1104/pp.111.187062. Epub 2011 Nov 22.

Color recovery after photoconversion of H2B::mEosFP allows detection of increased nuclear DNA content in developing plant cells

Affiliations

Color recovery after photoconversion of H2B::mEosFP allows detection of increased nuclear DNA content in developing plant cells

Michael Wozny et al. Plant Physiol. 2012 Jan.

Abstract

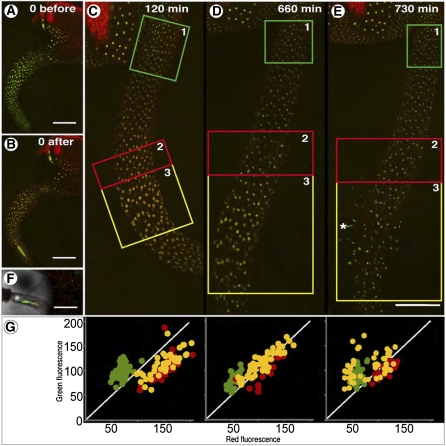
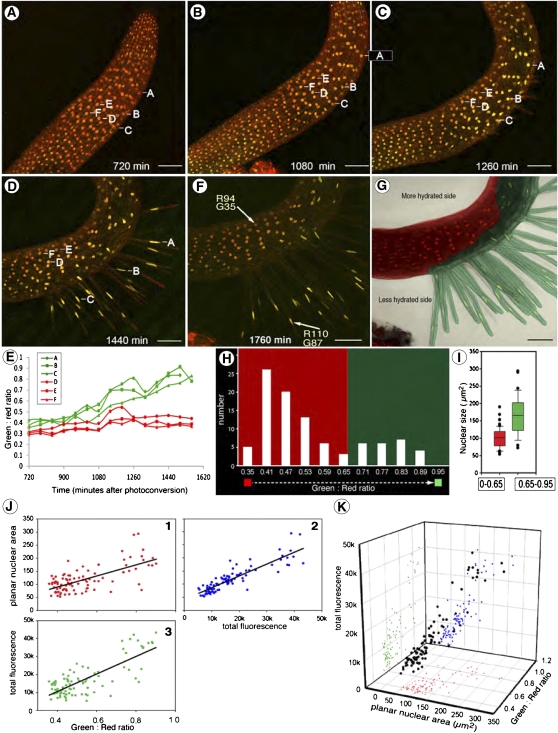
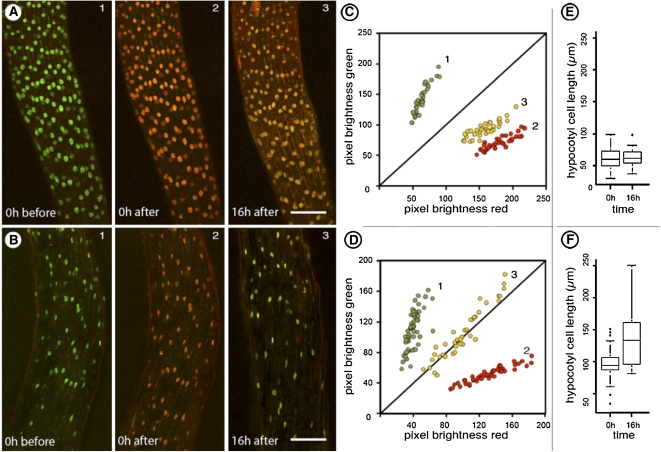
Many higher plants are polysomatic whereby different cells possess variable amounts of nuclear DNA. The conditional triggering of endocycles results in higher nuclear DNA content (C value) that in some cases has been correlated to increased cell size. While numerous multicolored fluorescent protein (FP) probes have revealed the general behavior of the nucleus and intranuclear components, direct visualization and estimation of changes in nuclear-DNA content in live cells during their development has not been possible. Recently, monomeric Eos fluorescent protein (mEosFP) has emerged as a useful photoconvertible protein whose color changes irreversibly from a green to a red fluorescent form upon exposure to violet-blue light. The stability and irreversibility of red fluorescent mEosFP suggests that detection of green color recovery would be possible as fresh mEosFP is produced after photoconversion. Thus a ratiometric evaluation of the red and green forms of mEosFP following photoconversion could be used to estimate production of a core histone such as H2B during its concomitant synthesis with DNA in the synthesis phase of the cell cycle. Here we present proof of concept observations on transgenic tobacco (Nicotiana tabacum) Bright Yellow 2 cells and Arabidopsis (Arabidopsis thaliana) plants stably expressing H2B::mEosFP. In Arabidopsis seedlings an increase in green fluorescence is observed specifically in cells known to undergo endoreduplication. The detection of changes in nuclear DNA content by correlating color recovery of H2B::mEosFP after photoconversion is a novel approach involving a single FP. The method has potential for facilitating detailed investigations on conditions that favor increased cell size and the development of polysomaty in plants.


Figures

Figure 1.
Figure 1.
Representative nuclear size and colors in stably transformed cells expressing H2B::mEosFP. Nuclei are green fluorescent when mEosFP is in an unphotoconverted state, fluoresce red following complete photoconversion, or appear yellow fluorescent when partial photoconversion results in nearly equal numbers of green and red molecules of mEosFP. A, Different nuclear sizes indicating polysomaty are seen on a single leaf from transgenic Arabidopsis. Whereas nuclei in guard cells (arrowheads) present the diploid (2n) state with 2 C nuclear DNA content a neighboring pavement cell (asterisk) possesses a larger nucleus whose DNA content may be 4 C or 8 C due to endoreduplication. B, A leaf epidermal hair (trichome; asterisk) exhibits a larger nucleus in comparison to green fluorescent nonphotoconverted nuclei in other epidermal cells, suggesting higher nuclear DNA content value of 16 or 32 C in the trichome. Photoconversion of a small region of the trichome nucleus (red) and observing it over 4 h suggested that red H2B::mEosFP does not diffuse within the nucleus of nondividing, terminally differentiated cells. C, Floral sepal cells from a transgenic Arabidopsis plant exhibit a wide range of nuclear sizes; arrowheads point to 2 C nuclei in guard cells while larger epidermal cells exhibit significantly bigger nuclei (red, yellow; asterisks), apparently due to higher nuclear DNA content. D, Nuclei in the root apex display a regular size distribution in comparison to cells of the leaf epidermis. A short irradiation of 6 s with violet-blue light step is sufficient for substantial photoconversion but leaves residual green fluorescence (compare section 2 to 3). E, Cells from a stably transformed tobacco BY2 cell suspension line exhibit bright fluorescent nuclei. An entire nucleus (asterisk) or a small portion (arrowheads) can be photoconverted into a red fluorescent color. F, A single nucleus preparing to undergo mitosis shows clear chromosomes of which some have been photoconverted into red color. G, Differentially colored chromosomes in a cell (boxed in E) maintain their photoconverted state while passing through the M phase of the cell cycle (1, late metaphase; 2, early anaphase; 3, late anaphase). Size bars: A, B, C, E = 25 μm; D = 50 μm; F and G = 5 μm.
Figure 2.
Figure 2.
Estimation of green color recovery after photoconversion of nuclei in hypocotyl and collet region of a transgenic Arabidopsis seedling expressing H2B::mEosFP. A, Seedling before photoconversion at the beginning of the time series showing emerging root. Most of the hypocotyl region is still within the seed coat. B, Seedling immediately after six photoconversion cycles of 30 s each, whereupon all nuclei are colored red. C to E, Seedling after 120, 660, and 730 min of growth during which the elongating hypocotyl emerges completely out of the seed coat. Nuclei in the newly emerging tissue are not photoconverted and appear green. Three regions can be discerned: 1, green box showing fresh emergent hypocotyl cells with green nuclei; 2, red box with photoconverted nuclei in hypocotyl cells; 3, yellow box with photoconverted nuclei in the collet zone of cellular differentiation. F, Magnified view of a single collet hair cell (asterisk in E) exhibiting a large green nucleus. G, Scatter plot of RG fluorescence brightness values (on a scale of 0–255; 256 color code) for individual nuclei from boxes 1, 2, and 3 in C, D, and E. At 120 min the photoconverted and unconverted areas show a clear difference in nuclear color. At 660 min the color separation is still maintained although the color of some photoconverted nuclei exhibits a slight shift toward green. At 730 min a major green shift in nuclear color is observed and is limited to individual, slightly elongated nuclei in hairs extended from the collet region. Nonphotoconverted nuclei in the hypocotyl (green box) and the autofluorescent seed coat (left corner) were used as internal controls for ensuring that image acquisition parameters have been maintained during the experiment (Supplemental Fig. S3). Size bars: A to E = 200 μm; F = 50 μm.
Figure 3.
Figure 3.
Confocal time-lapse imaging over 1,760 min of an Arabidopsis seedling expressing H2B::mEosFP and developing collet and root hairs asymmetrically due to differences in hydration levels on opposite sides of the seedling. A to D, Maximum intensity projections of z stacks taken at 720 (A), 1,080 (B), 1,260 (C), 1,440 (D), and 1,760 (E) min to assess color changes in nuclei. Six nuclei labeled A to F (section A) followed over time; nuclei A, B, and C belong to cells that exhibited rapid polar elongation whereas D, E, and F belong to cells that did not differentiate further. E, Color change in nuclei A to F (section A) calculated as the green to red ratio of the respective mean fluorescence values (0–255 value scale) plotted over time informs about the start time and progression through for an endocycle. F, Measurement of green (G) and red (R) fluorescence values in two visible nuclei (arrows) in the last image in the time series (1,760 min; F) suggests clear differences in color. G, Nuclei (n = 96) from epidermal and collet or root hair cells observed in F classed on the basis of their green to red ratio presented as a bar diagram. A value close to 0 represents a red and a ratio close to 1 a more green color. When considered overall the nuclei fall into two populations on the basis of their color. One population centers on green/red 0.47, and the other, separated by a gap of 0.65, around 0.77. H, A color overlay representation reflects the distribution of the two groups of different-colored nuclei with values below 0.65 depicted in red and above 0.65 overlaid in green. The seedling is divided into two asymmetrically developing zones. I, A box plot representing the two groups of different-colored nuclei with values below 0.65 depicted in red and above 0.65 depicted in green. The comparison of both populations shows that nuclei with ratios above 0.65 tend to be larger than nuclei below this ratio (P value < 0.00001). J, Establishing correlations between color change (green to red ratio) due to net increase in H2B::mEosFP content in nuclei, alteration in planer nuclear area, and the total nuclear fluorescence. Pairwise two-dimensional scatter plots showing planar nucleus area (in μm2; J1), the total nuclear fluorescence (J2), and the green to red ratio suggest a positive correlation between the three parameters (R2 J1 = 0.460; J2 = 0.711; J3 = 0.582). K, A combined three-dimensional scatter plot and multiregression analysis (ANOVA R2 = 0.8459) reaffirms a strong correlation of changes in the green to red ratio to other parameters.
Figure 4.
Figure 4.
Cell size and color change in nuclei of light- and dark-grown hypocotyl cells of transgenic Arabidopsis plants expressing H2B::mEosFP. A and B (section 1), Green fluorescent state of nuclei visible in seedlings grown in light. Section 2 shows the same seedlings irradiated with violet-blue light for 6 × 45 s to photoconvert nuclei into exhibiting red fluorescence. Subsequently the seedling in A was maintained in light while seedling B was kept in dark. Section 3 shows the two seedlings 16 h after photoconversion. The red color of nuclei is maintained in the light-grown seedling but nuclei in the dark-grown seedling shift to green. C and D, A scatter plot depicting green and red fluorescence values of individual nuclei in A (1–3) and B (1–3) confirms the shift toward green color that occurs in nuclei of dark-grown seedling (B, 3) in comparison to the nuclei of light-grown seedling (A, 3). E and F, Measurement of hypocotyl cells of light- (E) and dark-treated (F) seedlings shows that during the 16 h time that color change occurs in nuclei, the cells in dark-grown hypocotyl also undergo considerable elongation. Size bar in A and B = 100 μm.

Similar articles

Cited by

References

    1. Adachi S, Minamisawa K, Okushima Y, Inagaki S, Yoshiyama K, Kondou Y, Kaminuma E, Kawashima M, Toyoda T, Matsui M, et al. (2011) Programmed induction of endoreduplication by DNA double-strand breaks in Arabidopsis. Proc Natl Acad Sci USA 108: 10004–10009 - PMC - PubMed
    1. Barow M. (2006) Endopolyploidy in seed plants. Bioessays 28: 271–281 - PubMed
    1. Berger CA. (1941) Reinvestigation of polysomaty in spinacia. Bot Gaz 102: 759–769
    1. Boisnard-Lorig C, Colon-Carmona A, Bauch M, Hodge S, Doerner P, Bancharel E, Dumas C, Haseloff J, Berger F. (2001) Dynamic analyses of the expression of the HISTONE:YFP fusion protein in Arabidopsis show that syncytial endosperm is divided in mitotic domains. Plant Cell 13: 495–509 - PMC - PubMed
    1. Boudonck K, Dolan L, Shaw PJ. (1999) The movement of coiled bodies visualized in living plant cells by the green fluorescent protein. Mol Biol Cell 10: 2297–2307 - PMC - PubMed

Publication types

MeSH terms

LinkOut - more resources