Review
. 2011 Nov 23;13(1):51-62.
doi: 10.1038/nrn3136.

Normalization as a canonical neural computation

Affiliations
Review

Normalization as a canonical neural computation

Matteo Carandini et al. Nat Rev Neurosci. .

Erratum in

  • Nat Rev Neurosci. 2013 Feb;14(2):152

Abstract

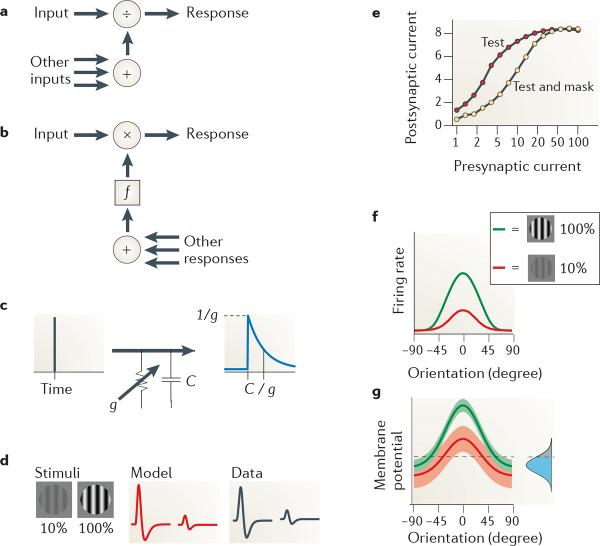
There is increasing evidence that the brain relies on a set of canonical neural computations, repeating them across brain regions and modalities to apply similar operations to different problems. A promising candidate for such a computation is normalization, in which the responses of neurons are divided by a common factor that typically includes the summed activity of a pool of neurons. Normalization was developed to explain responses in the primary visual cortex and is now thought to operate throughout the visual system, and in many other sensory modalities and brain regions. Normalization may underlie operations such as the representation of odours, the modulatory effects of visual attention, the encoding of value and the integration of multisensory information. Its presence in such a diversity of neural systems in multiple species, from invertebrates to mammals, suggests that it serves as a canonical neural computation.


Figures

Figure 1
Figure 1. Normalization in the olfactory system of the fruitfly
a | Responses of olfactory neurons in the antennal lobe to a single test odorant, as a function of activity in the presynaptic receptor neuron. γ and σ are constants (shown by the dotted line and the arrow). b | Responses of olfactory neurons in the antennal lobe to test odorant in the presence of mask odorants of increasing concentration (lower concentrations are shown by lighter colours). Curves are fits of the normalization model (equation 5), with Im free to vary with mask concentration. Data from REF. 27.
Figure 2
Figure 2. Normalization in retina
a | Light adaptation operates on light intensity to produce a neural estimate of contrast (multiple arrows indicate light intensities from multiple locations). b | Responses of a turtle cone photoreceptor to light of increasing intensity. The intensity of the coloured squares reflects background intensity. Curves are fits of normalization model (equation 5) with n = 1. c | Light adaptation moves the operating point to suit images of differing intensity. Histograms on abscissa indicate distributions of light intensity for a sinusoidal grating under dim illumination (shown in blue) and bright illumination (shown in green). Histograms on ordinate indicate distributions of responses, which are more similar to one another than the light intensity distributions. d | The same data as in part c | plotted as a function of local contrast (Weber contrast) rather than light intensity. Light adaptation makes responses roughly proportional to local contrast. The linear approximation given by equation 6 is shown (indicated by the dotted line). e | Contrast normalization operates on the neural estimate of contrast and normalizes it with respect to the standard deviation (sd) of nearby contrasts (multiple arrows indicate local contrast from multiple locations). f | Effects of contrast normalization. Responses of a neuron in lateral geniculate nucleus (which receives input from the retina) as a function of grating contrast and size. deg, degrees. Data in part b, from REF. 24. Data in part f, from REF. 40.
Figure 3
Figure 3. Normalization in primary visual cortex
a | Contrast saturation. Responses as a function of grating contrast for gratings having optimal orientation (shown in red) and suboptimal orientation (shown in yellow). b | Cross-orientation suppression. Responses to the sum of a test grating and an orthogonal mask grating (colours indicate mask contrast, from 0% (shown in yellow) to 50% (shown in dark red)). c | Transition from drive to suppression. Grating 1 had optimal orientation and grating 2 had suboptimal orientation. Grating 2 could provide some drive to the neuron when presented alone (shown in yellow) but became suppressive when grating 1 had moderate contrasts (shown in red). d | Surround suppression. A grating contained in a central disk was surrounded by a grating in an annulus. The annulus elicited minimal responses when presented alone, but suppressed responses to the central disk. e | Effects of normalization on population responses. Each dot indicates the response of a population of neurons selective for a given orientation, and each panel indicates the population responses to a stimulus. Stimuli are gratings of increasing contrast, presented alone (top) or together with an orthogonal grating (bottom). Data in part a from REF. 43; data in part b from REF. 56; data in part c from REF. 43; data in part d from REF. 142; data in part e from REF. 48.
Figure 4
Figure 4. Attentional modulation of responses in visual cortex and predictions of the normalization model of attention
a | A typical attention experiment. A pair of gratings is presented, one on each side of the fixation point (shown by a dot). The task engages attention around one of the gratings (shown by a red circle). One of the gratings lies in the summation field of a recorded neuron (shown by a dashed circle). b | In some experiments, attending to the stimulus in the summation field (shown by a red curve) changes contrast gain (leftward shift) relative to attending the opposite side (shown by a blue curve). The normalization model of attention predicts this result when the attended region is large and the stimulus is small relative to the summation and suppressive fields (shown in the inset). c | In other experiments, attention changes response gain (upward scaling). The model predicts this result for large stimulus size and small attended region (shown in the inset). d | Stimulus drive D(x,θ) for a population of neurons indexed by their preference for stimulus position x (abscissa) and orientation θ (ordinate) (the grey level indicates the stimulus drive for each neuron). e | Attentional gain factors A(x,θ) when attending to the stimulus on the right (the red circle in a) without regard to orientation (light grey indicates a value of 1 and white indicates a value >1). The attentional gain factors are multiplied point-by-point (×) with the stimulus drive. f | Normalization factors N(x,θ) are computed from the result of this multiplication, by pooling over space and orientation (shown by the asterisk) through convolution with the suppressive field α(x,θ). g | The output firing rates R(x,θ) of the population can be computed by dividing the stimulus drive (÷) by the normalization factors. Figure is modified, with permission, from REF. 46 © (2009) Cell Press.
Figure 5
Figure 5. Some networks and mechanisms that have been proposed for normalization
a | The connections underlying normalization can be arranged in a feedforward manner, in which signals contributing to the denominator have not been normalized themselves. b | An alternative configuration involves feedback. The function f performs the appropriate transformation of signals so that they can be multiplied by the input, giving rise to division in steady state,. c | A resistor–capacitor (C) circuit and its transformation of an impulse into an exponential response. Conductance g determines both response gain and time constant. d | Effect of stimulus contrast on impulse responses of a lateral geniculate nucleus (LGN) neuron. Increasing contrast (left part) causes impulse responses to be weaker and faster, both in the model (middle part) and in the data (right part). e | Synaptic depression as a mechanism for normalization. Depression changes the relationship between presynaptic current and postsynaptic current (arbitrary units) in a divisive way. f,g | Noise as a mechanism for normalization (arbitrary units). The transformation between stimulus-driven membrane potential (g) and firing rate (f) depends on signals originating from the rest of the brain in the form of `ongoing activity', modelled from the point of view of a single neuron as noise added to the membrane potential (shown by the inset Gaussian curve in g). Data in part d from REF. 35; data in part e from REF. 84; data in parts f and g from REF. 143.

Similar articles

Cited by

References

    1. Douglas RJ, Martin KAC, Whitteridge D. A functional microcircuit for cat visual cortex. J. Physiol. 1991;440:735–769. - PMC - PubMed
    1. Douglas RJ, Koch C, Mahowald M, Martin KAC, Suarez HH. Recurrent excitation in neocortical circuits. Science. 1995;269:981–985. - PubMed
    1. Wang XJ. Probabilistic decision making by slow reverberation in cortical circuits. Neuron. 2002;36:955–968. - PubMed
    1. Hanes DP, Schall JD. Neural control of voluntary movement initiation. Science. 1996;274:427–430. - PubMed
    1. Lo CC, Wang XJ. Cortico-basal ganglia circuit mechanism for a decision threshold in reaction time tasks. Nature Neurosci. 2006;9:956–963. - PubMed

Publication types