. 2011 Nov 22:7:550.
doi: 10.1038/msb.2011.84.

The quantitative proteomes of human-induced pluripotent stem cells and embryonic stem cells

Affiliations

The quantitative proteomes of human-induced pluripotent stem cells and embryonic stem cells

Javier Munoz et al. Mol Syst Biol. .

Abstract

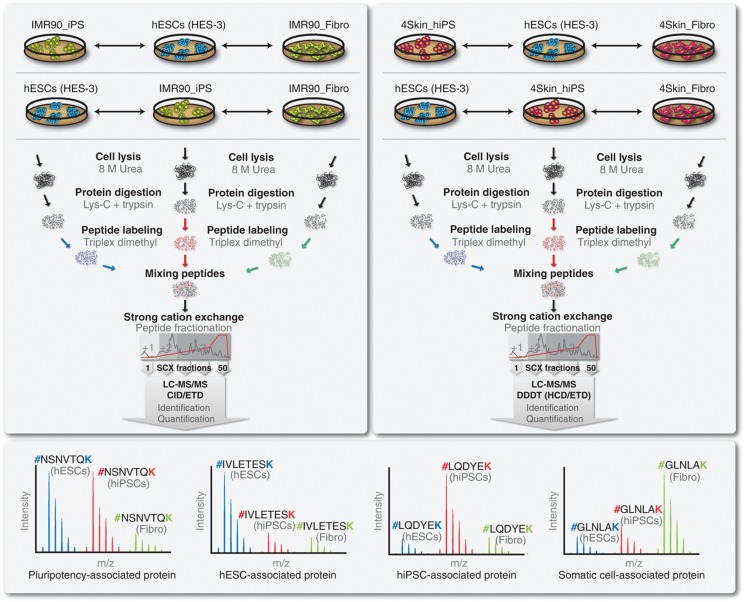
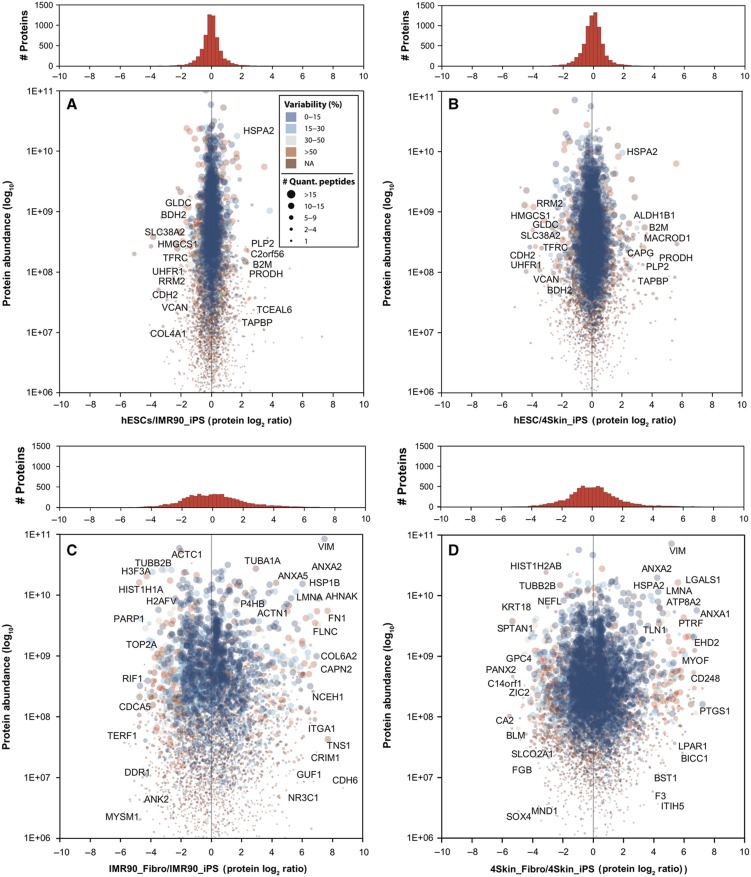
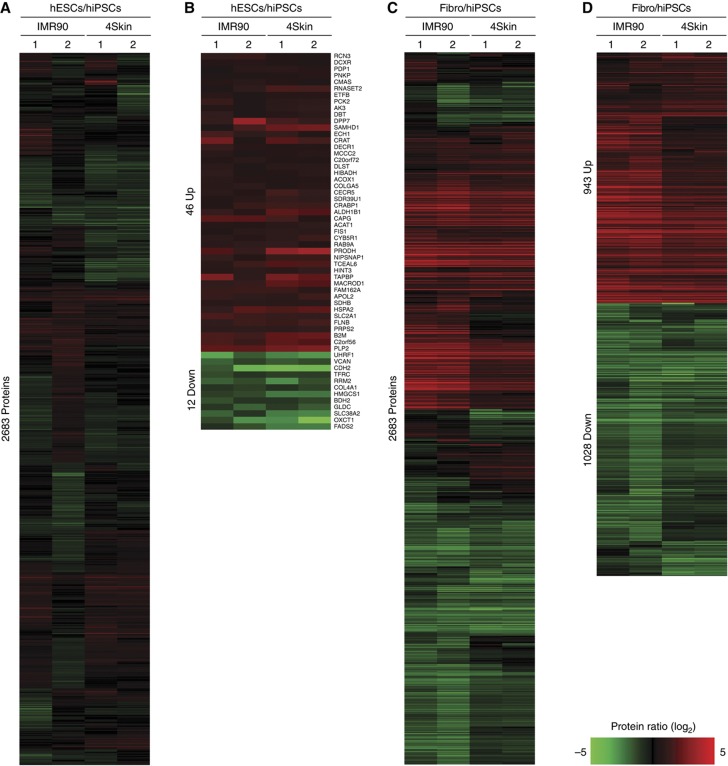
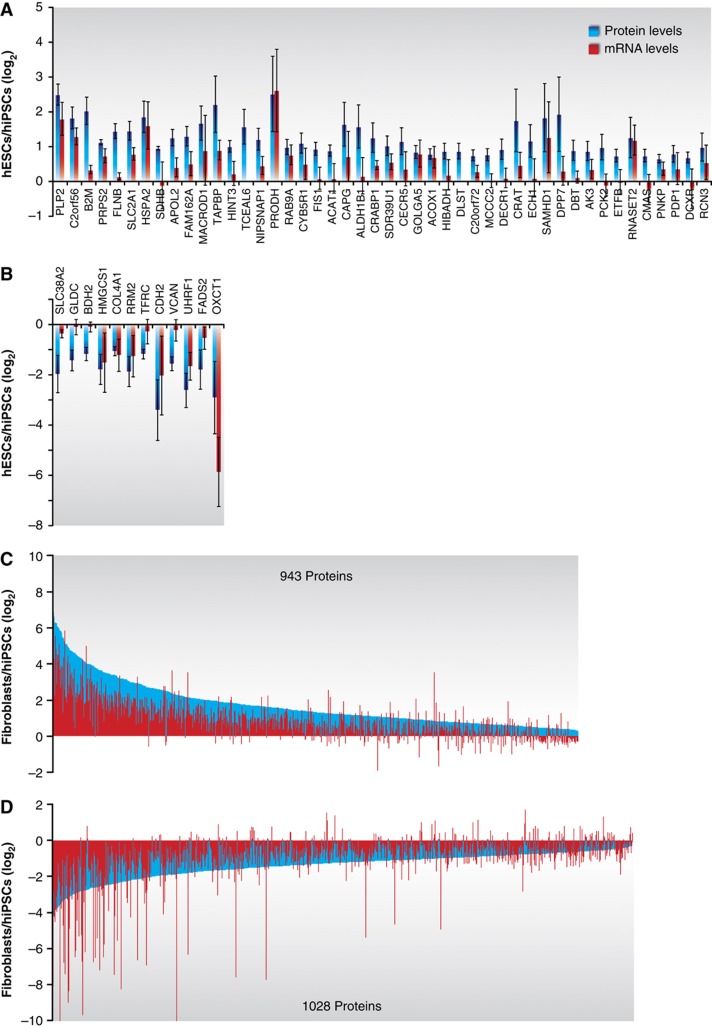
Assessing relevant molecular differences between human-induced pluripotent stem cells (hiPSCs) and human embryonic stem cells (hESCs) is important, given that such differences may impact their potential therapeutic use. Controversy surrounds recent gene expression studies comparing hiPSCs and hESCs. Here, we present an in-depth quantitative mass spectrometry-based analysis of hESCs, two different hiPSCs and their precursor fibroblast cell lines. Our comparisons confirmed the high similarity of hESCs and hiPSCS at the proteome level as 97.8% of the proteins were found unchanged. Nevertheless, a small group of 58 proteins, mainly related to metabolism, antigen processing and cell adhesion, was found significantly differentially expressed between hiPSCs and hESCs. A comparison of the regulated proteins with previously published transcriptomic studies showed a low overlap, highlighting the emerging notion that differences between both pluripotent cell lines rather reflect experimental conditions than a recurrent molecular signature.


Conflict of interest statement

The authors declare that they have no conflict of interest.

Figures

Figure 1
Figure 1
Experimental workflow and overview of the proteomic experiments performed. To characterize the proteomes of human-induced pluripotent stem cells (hiPSCs) and human embryonic stem cells (hESCs), two MS-based experiments, using two independent hiPS cell lines, were conducted. Experiment 1 (top-left panel) focused on hiPS_IMR90, hESCs and IMR90 fetal fibroblasts (cell line used for reprogramming). Experiment 2 (top-right panel) focused on hiPS_4Skin, hESCs and parental 4Skin fetal fibroblasts. Proteins were extracted and digested with Lys-C and trypsin. Peptides were labeled using triplex dimethyl chemistry, equally mixed and prefractionated by using strong cation exchange (SCX). Two biological replicas were performed for each experiment, where labels were swapped between hiPSCs and hESCs. SCX fractions were analyzed by high-resolution LC-MS/MS. Experiment 1 was analyzed with an LTQ Orbitrap XL using both CID and ETD fragmentations, whereas Experiment 2 was analyzed with an LTQ Orbitrap Velos using a data-dependent decision tree (DDDT) using HCD and ETD. The peak intensities of the identified peptides reflect their relative abundance in the samples (bottom panel).
Figure 2
Figure 2
Quantitative proteomic comparisons of hESCs, two hiPSCs and their precursor fibroblast cell lines. Protein abundances (Grossmann et al, 2010) are plotted against protein ratios for the hESCs/IMR90_iPS (A), hESCs/4Skin_iPS (B), IMR90_Fibro/IMR90_iPS (C) and 4Skin_Fibro/4Skin_iPS (D) comparisons. The size of the spot reflects the number of unique peptides used to calculate the protein ratio. The color code reflects the variability (i.e., relative standard deviation) of the peptide ratios for each protein. On top, the histograms of frequencies show the density of proteins in each analysis using a bin size of 0.25 (log2). Some of the proteins that are discussed in the text are shown in the plots. NA, not applicable.
Figure 3
Figure 3
Proteome differences between hESCs, hiPSCs and their precursor fibroblasts. 2683 proteins were quantified in the four data sets: IMR90 and 4Skin experiments (Biological replicas 1 and 2). Relative protein abundances are represented as heatmaps for hESCs/hiPSCs (A) and fibroblasts/hiPSCs (C) comparisons. Using significance analysis of microarrays (SAM; Tusher et al, 2001; Roxas and Li, 2008), 58 proteins (2.2%) were found significantly regulated between hESCs/hiPSCs (B) and 1927 (73.4%) between fibroblasts/hiPSCs (D). The figure was created using the MultiExperiment Viewer software (Saeed et al, 2006). Red and green colors indicate upregulated and downregulated events, respectively. Genes were further grouped using hierarchical clustering (distance metric was Cosine correlation and linkage method was average).
Figure 4
Figure 4
Transcript levels of the differentially expressed proteins between hiPSCs and hESCs. The mRNA levels of the identified proteins were measured on the same samples that were used for the proteomic analyses using microarrays (Affymetrix platform). Gene symbols were used to correlate the measurements from both approaches. The figure shows the transcript levels for all the significantly regulated proteins found for hESCs>hiPSCs (A), hESCs<hiPSCs (B), fibroblasts>hiPSCs (C) and fibroblasts<hiPSCs (D). Protein and mRNA ratios were calculated as the average of the four measurements obtained (IMR90 and 4Skin experiments with two biological replicas each). The corresponding error bars (standard deviations) are shown for each value (error bars in C and D were omitted for a better visualization of the figure).

References

    1. Adewumi O, Aflatoonian B, Ahrlund-Richter L, Amit M, Andrews PW, Beighton G, Bello PA, Benvenisty N, Berry LS, Bevan S, Blum B, Brooking J, Chen KG, Choo ABH, Churchill GA, Corbel M, Damjanov I, Draper JS, Dvorak P, Emanuelsson K et al. (2007) Characterization of human embryonic stem cell lines by the International Stem Cell Initiative. Nat Biotechnol 25: 803–816 - PubMed
    1. Anokye-Danso F, Trivedi CM, Juhr D, Gupta M, Cui Z, Tian Y, Zhang Y, Yang W, Gruber PJ, Epstein JA, Morrisey EE (2011) Highly efficient miRNA-mediated reprogramming of mouse and human somatic cells to pluripotency. Cell Stem Cell 8: 376–388 - PMC - PubMed
    1. Avilion AA, Nicolis SK, Pevny LH, Perez L, Vivian N, Lovell-Badge R (2003) Multipotent cell lineages in early mouse development depend on SOX2 function. Genes Dev 17: 126–140 - PMC - PubMed
    1. Baker DEC, Harrison NJ, Maltby E, Smith K, Moore HD, Shaw PJ, Heath PR, Holden H, Andrews PW (2007) Adaptation to culture of human embryonic stem cells and oncogenesis in vivo. Nat Biotechnol 25: 207–215 - PubMed
    1. Berger SL (2007) The complex language of chromatin regulation during transcription. Nature 447: 407–412 - PubMed

Publication types