. 2011 Nov 22:7:551.
doi: 10.1038/msb.2011.83.

Structural and functional protein network analyses predict novel signaling functions for rhodopsin

Affiliations

Structural and functional protein network analyses predict novel signaling functions for rhodopsin

Christina Kiel et al. Mol Syst Biol. .

Abstract

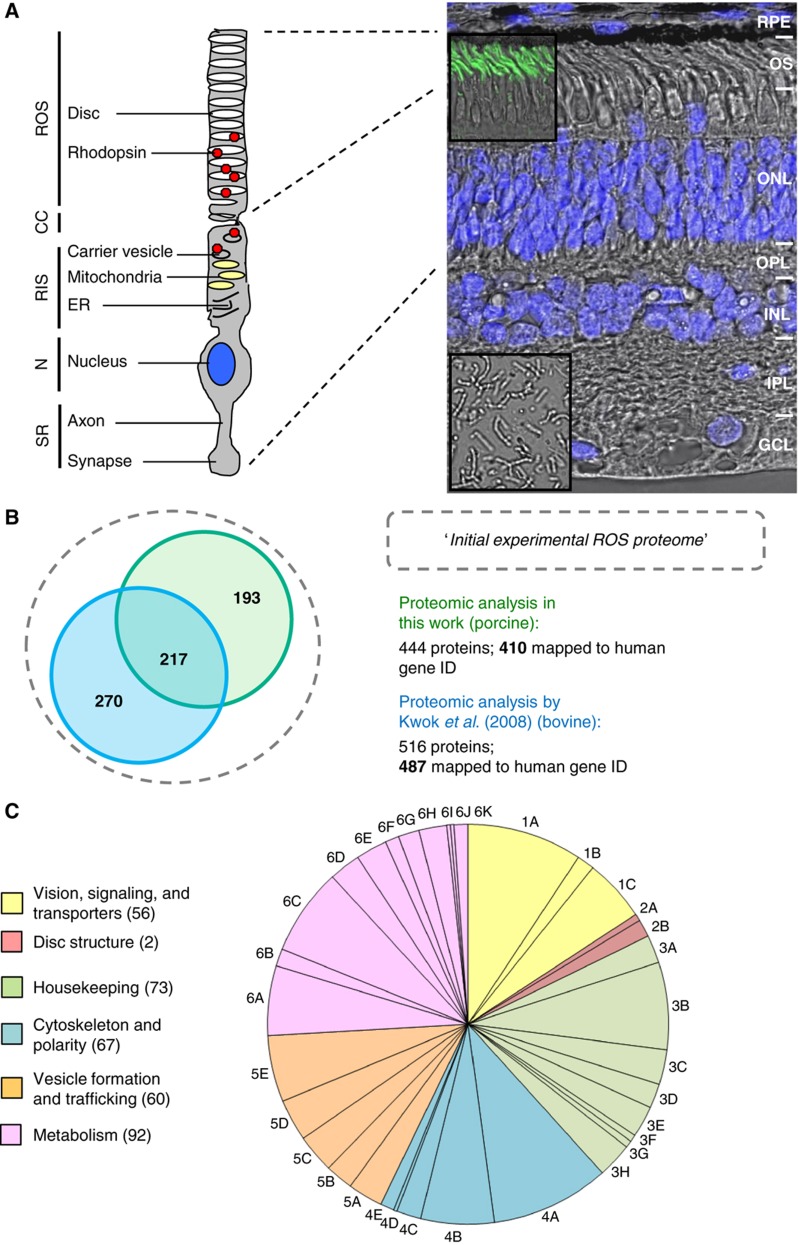
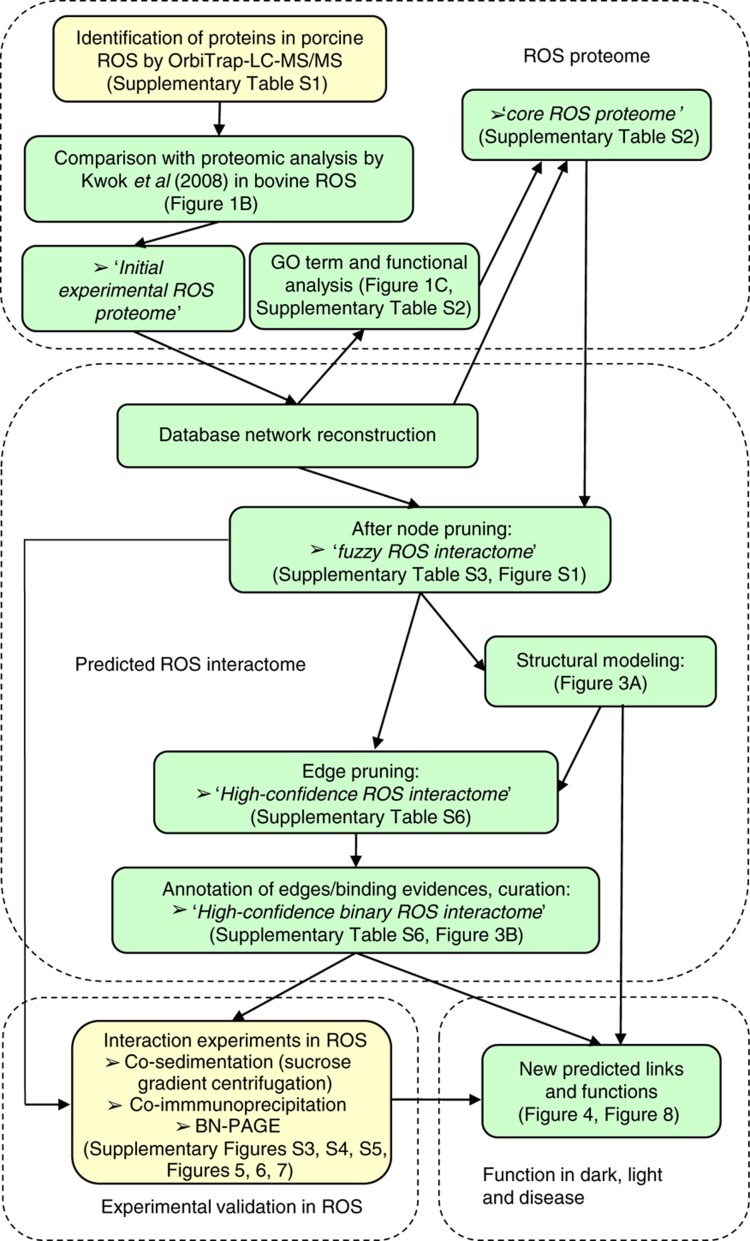
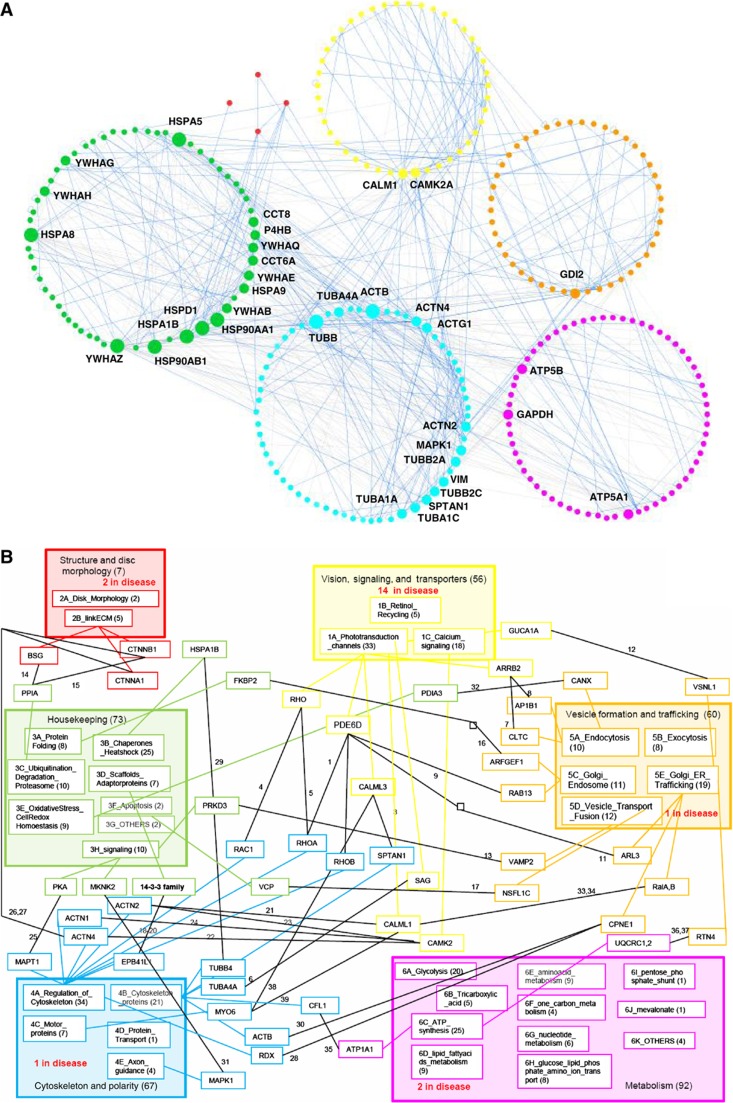
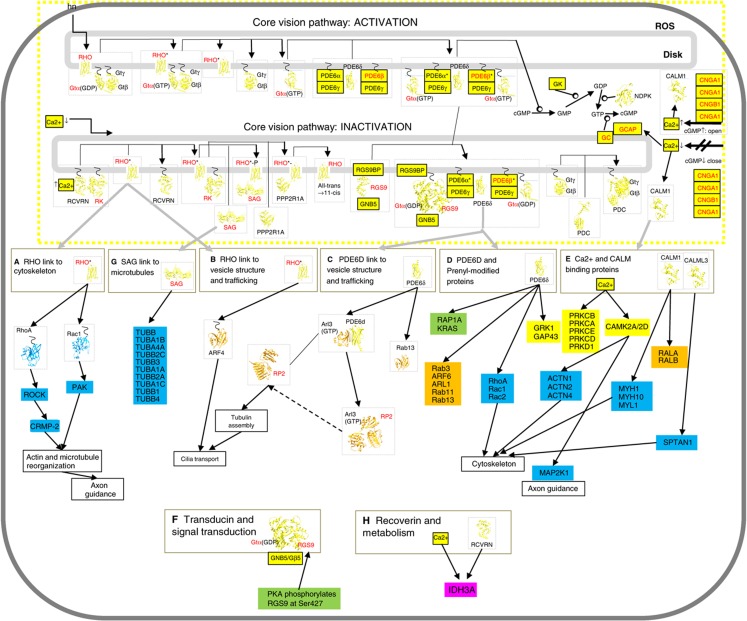
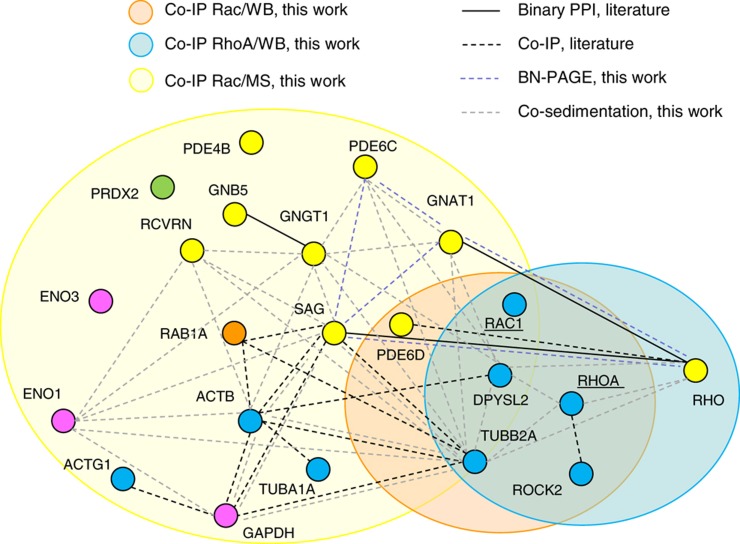
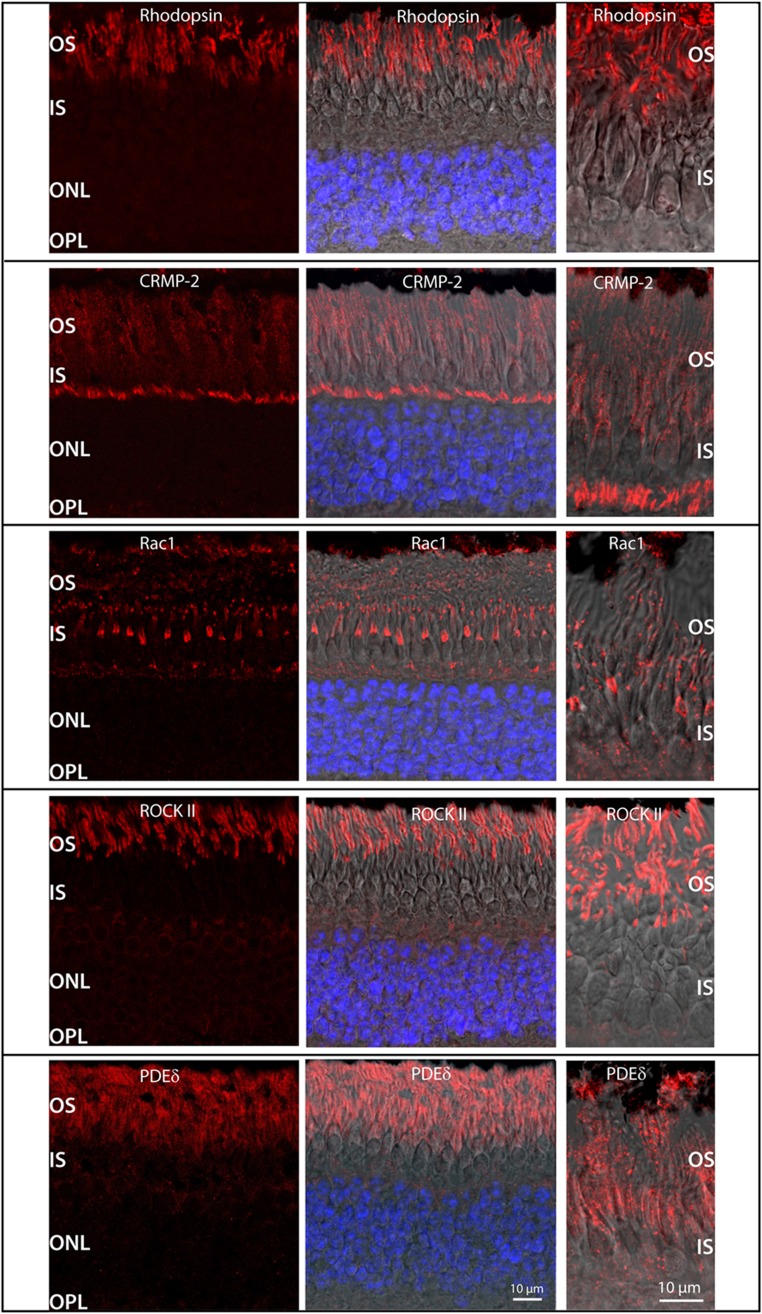
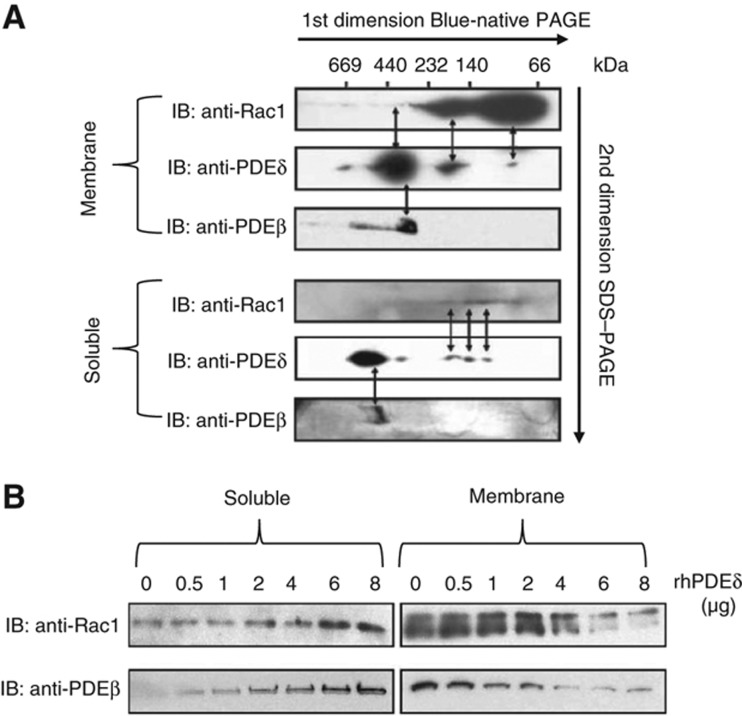
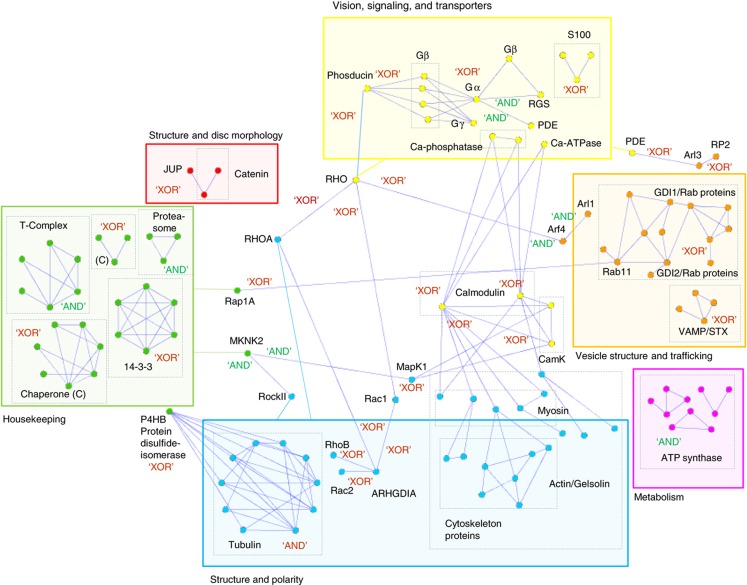
Orchestration of signaling, photoreceptor structural integrity, and maintenance needed for mammalian vision remain enigmatic. By integrating three proteomic data sets, literature mining, computational analyses, and structural information, we have generated a multiscale signal transduction network linked to the visual G protein-coupled receptor (GPCR) rhodopsin, the major protein component of rod outer segments. This network was complemented by domain decomposition of protein-protein interactions and then qualified for mutually exclusive or mutually compatible interactions and ternary complex formation using structural data. The resulting information not only offers a comprehensive view of signal transduction induced by this GPCR but also suggests novel signaling routes to cytoskeleton dynamics and vesicular trafficking, predicting an important level of regulation through small GTPases. Further, it demonstrates a specific disease susceptibility of the core visual pathway due to the uniqueness of its components present mainly in the eye. As a comprehensive multiscale network, it can serve as a basis to elucidate the physiological principles of photoreceptor function, identify potential disease-associated genes and proteins, and guide the development of therapies that target specific branches of the signaling pathway.


Conflict of interest statement

The authors declare that they have no conflict of interest.

Figures

Figure 1
Figure 1
Proteomic description of the retina ROS inventory and GO analysis. (A) Schematic model of a rod photoreceptor cell (left) and its corresponding location within the retina (depicted in the micrograph to the right). Segments labeled in the model are ROS with enclosed stacks of discs membranes containing the visual pigment molecules rhodopsin; CC; RIS containing mitochondria, Golgi, and ER membranes, and vesicles in which opsin molecules are assembled before transported to the outer segment; and the cell body containing the nucleus and a synaptic termini, where neurotransmission to second-order neurons occurs. The micrograph depicts the vertical porcine retina with its cytoarchitectural organization labeled as photoreceptor outer segments (OSs); the outer nuclear layer (ONL) containing cell bodies of rods and cones; the outer plexiform layer (OPL); the inner nuclear layer (INL); the inner plexiform layer (IPL), and the ganglion cell layer (GCL). The retinal pigment epithelium (RPE) is localized above the photoreceptor cell layer (for details, see http://webvision.med.utah.edu). Retinal cells nuclei were stained with DAPI (magnification × 40). Insets show micrographs of the OS immunolabeled with anti-rhodopsin with an FITC-conjugated secondary antibody (magnification × 40; top inset) and of the OS preparation (magnification × 40; bottom inset). (B) Comparison of different proteomic data sets determined in ROS, based on proteins and the protein overlap identified in the proteomic analysis from this work and that of Kwok et al (2008). The union of the two data sets was defined as the initial experimental ROS proteome. (C) Functional modules and GO analyses of the filtered core ROS proteome. By performing an automatic and a manual GO search (based on the UniProt and KEGG databases), we characterized the 355 proteins (see Supplementary Table S2) to be involved in vision, signaling, transport, and channels (56), disc structure and morphology (7), housekeeping functions (73), cytoskeleton and polarity (67), vesicle, structure, and trafficking (60), and metabolism (92). Sub-modules/sub-functions of the GO terms are indicated as described in Supplementary Table S2 (1A, phototransduction/channels (33); 1B, retinol recycling (5); 1C, calcium signaling (18); 2A, disk morphology (2); 2B, link to ECM (5); 3A, protein folding (8); 3B, chaperones/heat shock (25); 3C, ubiquitination/degradation/proteasome (10); 3D, scaffolds/adaptor proteins (7); 3E, oxidative stress/cell redox homoestasis (9); 3F, apoptosis (2); 3G, others (2); 3H, signaling (10); 4A, regulation of cytoskeleton (34); 4B, cytoskeleton proteins (21); 4C, motor proteins (7); 4D, protein transport (1); 4E, axon guidance (4); 5A, endocytosis (10); 5B, exocytosis (8); 5C, Golgi endosome (11); 5D, vesicle transport/fusion (12); 5E, Golgi/ER/trafficking (19); 6A, glycolysis (20); 6B, tricarboxylic acid (5); 6C, ATP synthesis (25); 6D, lipid/fatty acids metabolism (9); 6E, amino-acid metabolism (9); 6F, one-carbon metabolism (4); 6G, nucleotide metabolism (6); 6H, glucose/lipid/phosphate/amino acid/ion transport (8); 6I, pentose phosphate shunt (1); 6J, mevalonate (1); and 6K, others (4)).
Figure 2
Figure 2
Experimental and computational workflow. The flow charts of experimental (yellow boxes) and bioinformatic (green boxes) methods used in this work are shown. The initial ROS proteome was generated based on the union of proteins identified in bovine ROS in this work and those from a proteomic analysis of porcine ROS (Kwok et al, 2008). After filtering, a high-confidence ROS proteome was defined. A static ROS interactome was compiled by literature mining. In addition, new experiments were performed in ROS in this work (co-sedimentation and co-IP). Further, we performed structural analyses and homology modeling to distinguish between compatible and mutually exclusive interactions. This enabled us to break the network of nodes and edges into functional machines or sub-networks and modules. The comprehensive multiscale network highlights new predicted links and functions. Finally, disease-associated genes were identified and modeled into available structures.
Figure 3
Figure 3
The high-confidence ROS interactome and the high-confidence binary ROS interactome. (A) The high-confidence ROS interactome. The 660 higher confidence interactions of the ROS interactome are listed (Supplementary Table S6). The size of the nodes indicates the number of interaction partners for a given protein (of >10 or >20). Edges with binary evidence are indicated with blue, while edges supported by more than one piece of evidence are indicated in gray. Proteins are colored according to their function. (B) The high-confidence binary ROS interactome. Modules and sub-modules are shown, and only the interactions of proteins from two different modules are indicated (see Supplementary Material 2). The number of proteins implicated in diseases in each category is indicated.
Figure 4
Figure 4
Structural coverage of the core vision pathway and its links to other functional modules. The published core pathway (Dell'Orco et al, 2009) was extended using evidence from our high-confidence network. Outputs to different functional cellular processes emanating from the proteins in the pathway are indicated, and the available structures are displayed by ribbon representation (see the main text and Supplementary Material 2). Proteins are colored according to their function.
Figure 5
Figure 5
Graphical representation of experiments performed in this work and its comparison with interactions described in the literature. Protein complexes that were obtained using Rac1, RhoA, or Rac1 as the bait protein are displayed within orange, blue, and yellow circles, respectively. The Rac1 and RhoA complexes were identified by western blot, and the Rac1 complex by Orbitrap. The overlap of the three circles indicates the proteins that were identified in the same complex in one of the three experiments. Connecting lines between proteins indicate either binary or co-IP interactions from the literature, or from BN-PAGE or co-sedimentation interactions as determined in this work. Proteins are colored according to their function.
Figure 6
Figure 6
Immunohistochemical analyses of porcine retina. Cryostat sections of the retina were stained with primary antibodies (red) against indicated proteins, and nuclei were counterstained (blue). The images on the left were taken from the outer retina (outer segments (OS), inner segments (IS), outer nuclear layer (ONL), and outer plexiform layer (OPL)). Images in the middle are an overlay of antibody staining, nuclei staining, and DIC optics (Nomarski). Images on the right were taken with higher magnification, to focus on the OS and IS. All indicated proteins were unambigiously identified as constituents of ROS. Control sections without primary antibodies showed no staining (Supplementary Figure S7).
Figure 7
Figure 7
Experimental evidence that PDEδ acts as a GDI for Rac1 in ROS. (A) PDEδ and Rac1 colocalize in ROS in native protein complexes. After solubilization with β-DM, native ROS protein complexes from soluble and membranous fractions of light- and dark-adapted ROS were separated by BN-PAGE. Components of the native protein complexes were separated by SDS–PAGE for second-dimension electrophoresis. Western blots with anti-Rac1 and anti-PDEδ antibodies showed that PDEδ and Rac1 colocalized but were in different complexes in ROS depending on the dark-adapted state of the retina. Colocalization of PDEδ and Rac1 seemed to be stronger in the dark-adapted state, where both proteins colocalized to the soluble and membranous fractions. In light-adapted ROS, colocalization of PDEδ and Rac1 was detected only in the membranous fraction but not in the soluble fraction. (B) In-vitro solubilization of Rac1 GTPase from light- and dark-adapted ROS membranes. Membranes isolated from light- or dark-adapted ROS were incubated for 1 h at 37°C with different amounts of recombinant human PDEδ (rhPDEδ) or buffer alone, and the unsolubilized material was recovered by ultracentrifugation. Immunoblots with anti-Rac1 or anti-PDEδ antibodies showed that PDEδ solubilizes Rac1 from ROS membranes in a dose-dependent manner. Since it has been previously determined that PDEδ solubilizes PDEδ from ROS membranes in a dose-dependent manner (Florio et al, 1996), this was used here to demonstrate the functional activity of the rhPDEδ protein.
Figure 8
Figure 8
Network representations distinguishing mutually exclusive from compatible interactions, based on structural information. All protein–protein interactions for which structural information was available (Supplementary Table S4), and for which structural superimpositions were performed (Supplementary Figure S9), are represented here. Mutually exclusive complexes are indicated with ‘XOR’, and compatible interactions are indicated with ‘AND’. Proteins are colored according to their function (see Figure 3B).

References

    1. Adams M, Smith UM, Logan CV, Johnson CA (2008) Recent advances in the molecular pathology, cell biology and genetics of ciliopathies. J Med Genet 45: 257–267 - PubMed
    1. Aloy P, Russell RB (2002) Interrogating protein interaction networks through structural biology. Proc Natl Acad Sci USA 99: 5896–5901 - PMC - PubMed
    1. Aloy P, Russell RB (2003) InterPreTS: protein interaction prediction through tertiary structure. Bioinformatics 19: 161–162 - PubMed
    1. Artemyev NO (2008) Light-dependent compartmentalization of transducin in rod photoreceptors. Mol Neurobiol 37: 44–51 - PubMed
    1. Balasubramanian N, Levay K, Keren-Raifman T, Faurobert E, Slepak VZ (2001) Phosphorylation of the regulator of G protein signaling RGS9-1 by protein kinase A is a potential mechanism of light- and Ca2+-mediated regulation of G protein function in photoreceptors. Biochemistry 40: 12619–12627 - PubMed

Publication types