. 2011 Nov 22:7:554.
doi: 10.1038/msb.2011.87.

Niche adaptation by expansion and reprogramming of general transcription factors

Affiliations

Niche adaptation by expansion and reprogramming of general transcription factors

Serdar Turkarslan et al. Mol Syst Biol. .

Abstract

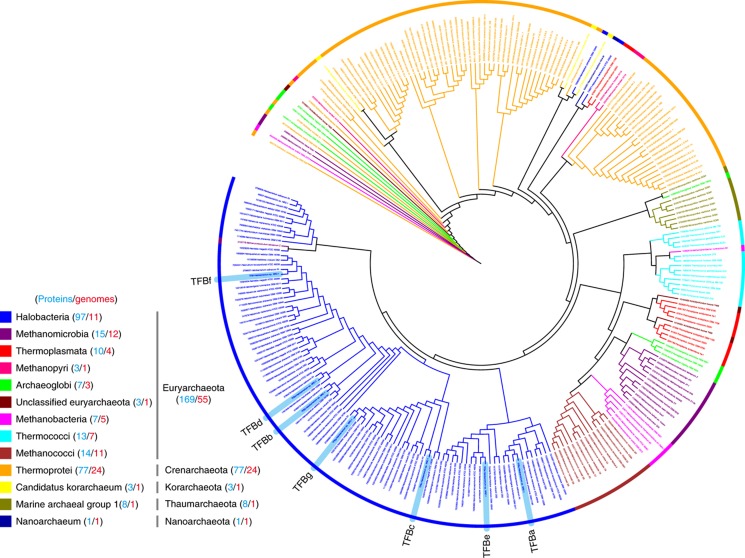
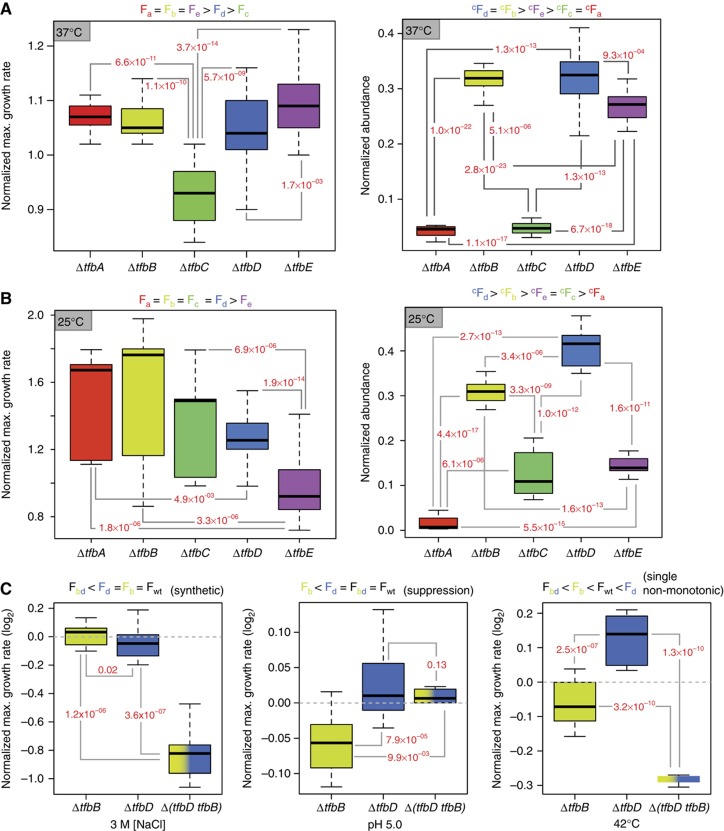
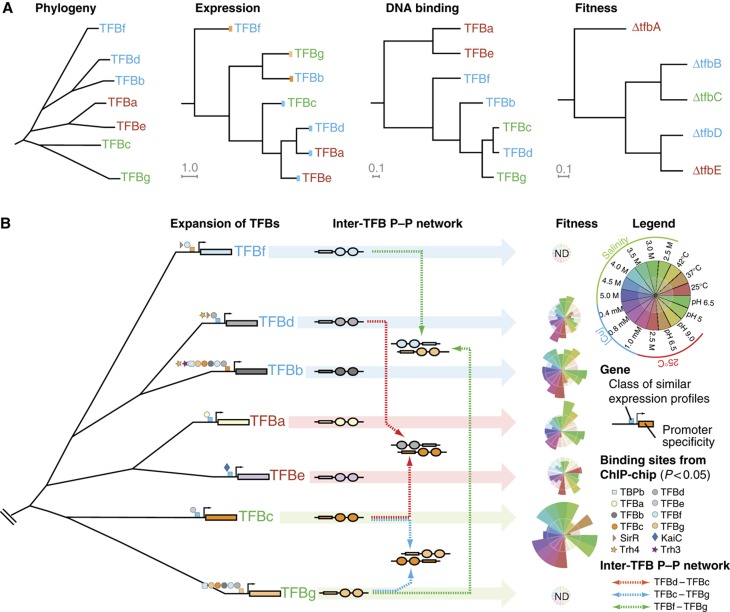
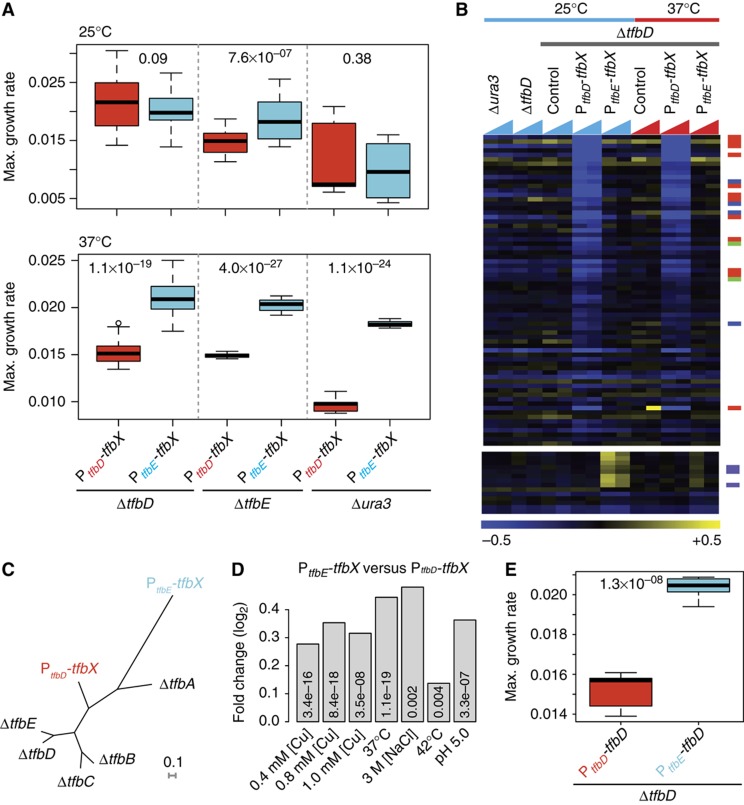
Numerous lineage-specific expansions of the transcription factor B (TFB) family in archaea suggests an important role for expanded TFBs in encoding environment-specific gene regulatory programs. Given the characteristics of hypersaline lakes, the unusually large numbers of TFBs in halophilic archaea further suggests that they might be especially important in rapid adaptation to the challenges of a dynamically changing environment. Motivated by these observations, we have investigated the implications of TFB expansions by correlating sequence variations, regulation, and physical interactions of all seven TFBs in Halobacterium salinarum NRC-1 to their fitness landscapes, functional hierarchies, and genetic interactions across 2488 experiments covering combinatorial variations in salt, pH, temperature, and Cu stress. This systems analysis has revealed an elegant scheme in which completely novel fitness landscapes are generated by gene conversion events that introduce subtle changes to the regulation or physical interactions of duplicated TFBs. Based on these insights, we have introduced a synthetically redesigned TFB and altered the regulation of existing TFBs to illustrate how archaea can rapidly generate novel phenotypes by simply reprogramming their TFB regulatory network.


Conflict of interest statement

The authors declare that they have no conflict of interest.

Figures

Figure 1
Figure 1
Lineage-specific expansion of the TFB family in Archaea. Phylogenetic analysis of TFB proteins in Archaea highlights the extent of lineage-specific expansion particularly in halophilic archaea. Amino-acid sequences for TFBs from 82 complete archaeal genome sequences (MicrobesOnline (Dehal et al, 2010)) were aligned with MUSCLE (Edgar, 2004) and a phylogenetic tree was constructed as described in Materials and methods. Branches belonging to the same phylum and class are colorized based on taxonomy using Archaeopteryx (Han and Zmasek, 2009) and iTOL (Letunic and Bork, 2011). Tree is outlined with the same colors to highlight expansions in the similar class ranges. Color code for each class, corresponding phylum, number of genomes (red color), and number of proteins (blue color) are given in the legend. Halophilic archaeal TFBs are highlighted in blue background. Sequences used in this analysis are listed in Supplementary Table S1.
Figure 2
Figure 2
Fitness contributions of TFBs across diverse environments reveal their complex and overlapping functions. Growth assays were performed in high throughput by tracking cell density at OD600 using the Bioscreen C instrument as described in Materials and methods. We determined the maximum growth rates (fitness) from smooth spline fitted growth curves after depositing cell density measurements into a database with relevant meta-information and associated plate layout information. Maximum growth rate of each TFB knockout was normalized to appropriate controls and log2 ratios were reported as normalized maximum growth rates or fitness (Supplementary Table S3). (A) Distinct trends in fitness contribution of TFBs across specific environmental gradients. The condition-specific fitness trends (normalized maximum growth rate) of each TFB knockout strain can be viewed as evidence for complex patterns of subfunctionalizations. (B) Relative order of fitness contributions of TFBs changes with environmental context. Fitness of each TFB knockout was subtracted from fitness of the parent to obtain degree of fitness contributed by that TFB in each environment (plotted on the y axis as ‘TFB Fitness’). Statistical significance of fitness differences among pairs of TFBs was calculated using t-test (Supplementary Figure S1). Starting with the lowest fitness contributing TFB on the left boxplots of the TFBs are rank ordered with increasing fitness contributions going rightward. The different orderings of the TFBs in these rank-ordered plots demonstrate how TFBs take turns in assuming a primary role across the 17 environmental conditions. (C) Distribution of different clades of TFBs across all of the 11 fully sequenced halophilic archaeal genomes. Clade membership of TFBs was assigned based on similarity to H. salinarum NRC-1 family members. Numbers in parenthesis indicate total number of TFB proteins in each species. While TFBf- and TFBc/TFBg-like proteins are present in all archaea, TFBb/TFBd- and TFBa/TFBe-like proteins are limited to certain species (Supplementary Table S1).
Figure 3
Figure 3
Functional hierarchies and genetic interactions of TFBs change with environmental context. Relative fitness levels of TFB knockouts in pure cultures at 37°C (A, left) and 25°C (B, left) were determined as described in Figure 2. Competition experiments were performed by mixing equal numbers of cells of each TFB knockout grown to mid-log phase of growth. The mixed cultures were incubated at 37°C (A, right) or 25°C (B, right) to OD600∼0.4 when they were serially diluted into fresh medium to a final OD600 of 0.05. The competition was performed over ∼22 generations and relative success of each TFB was determined by tracking the relative abundance of the knockout strains with qRT–PCR. Significance of fitness differences between pairs of TFBs was determined using two-sample t-test and P-values for significant changes are reported in red font adjacent to lines connecting respective TFB pairs. Ranking of relative fitness of each TFB knockout is indicated on top of each plot. (F: fitness in pure cultures; cF: fitness in competition.) Difference in rank order of F and cF of knockouts in the same environment suggest division of labor among the TFBs that is not at all apparent when they are cultured individually. Consistent with the results in Figure 2B, difference in cF across environments (25 and 37°C) further demonstrates that the TFBs switch their relative roles (primary, secondary, tertiary, etc.) depending on context. (C) Functional (genetic) interactions among TFBs vary by environmental context. Genetic interactions between tfbB and tfbD were determined by assessing fitness differences (t-test, P<0.01) of single (ΔtfbB or ΔtfbD) and double (ΔtfbBΔtfbD) knockout strains. Mode of genetic interactions was assigned based on fitness inequalities indicated on top of each graph (Fb: fitness of ΔtfbB; Fd: fitness of ΔtfbD; Fbd: fitness of ΔtfbB ΔtfbD; Fwt: fitness of WT) per the scheme devised by Carter et al (2009).
Figure 4
Figure 4
Reconstruction of evolutionary events responsible for the extant architecture of the seven TFB GRN in H. salinarum NRC-1. (A) Relationships among TFBs at the level of their phylogeny, regulation, distribution of their DNA-binding locations, and fitness contributions. Font coloring of TFBs indicates their clade membership. The first tree shows phylogenetic relationships of TFBs based on the amino-acid sequence similarities. The second tree illustrates relationships in regulation (‘cis-mutations’) of TFBs that were determined by hierarchical clustering of their transcript level changes across 361 environmental conditions. It is clear from this tree that TFBs from the same clade (see b/d/f and g/c clades) are expressed under very different regulatory schemes. The blue and orange color bars on the leaves of this tree indicate related expression profiles; this color code is also utilized in (B) to help the reader relate these data across the two panels. Relationships at the level of DNA binding (‘trans-mutations’) were determined by clustering the hypergeometric P-values for shared-binding sites among pairs of TFBs (Supplementary Table S6). This plot reveals that similarity of DNA-binding specificity is mostly consistent with TFB relationships at the primary sequence level with some important exceptions (see text for details). Finally, similarities in fitness contributions of TFBs across 17 different environments are explained by a combination of cis- and trans-mutations (see text for details). (B) Changes to both cis and trans segments of TFBs need to be considered to explain current day architecture of the seven TFB GRN. This reconstruction was done in the framework of gene duplication events that were inferred from phylogenetic analysis. Promoter evolution was reconstructed by integrating experimentally mapped TF-binding sites (Facciotti et al, 2007) of eight GTFs and four regulators in the TFB promoters, and transcript level changes (A; see inset key). This reconstruction explains subtle differences in the regulation of phylogenetically related TFBs in context of gain and loss of TF-binding sites (for instance, relative to TFBb, the TFBd promoter has gained a TF-binding site for SirR but lost TF-binding sites for six GTFs and Trh3). This reconstruction also reveals convergent evolution of promoters for TFBs from different clades (for instance, TFBc and TFBe); notably, the set of TFs whose TF-binding sites were mapped do not explain the similar expression profiles of TFBc and TFBe. An intra-TFB protein–protein network occurs away from DNA and is speculated to modulate recruitment of these factors to cognate promoters. Coupled changes in DNA-binding specificities of TFBs, their regulation and their protein interactions mediates transcriptional segregation of different aspects of physiology and corresponding environment-specific subfunctionalization of individual TFBs (height of a colored sector in each star plot is proportional to the normalized fitness contribution of that TFB in a particular environment; see inset).
Figure 5
Figure 5
The importance of cis- and trans-mutations in altering fitness programs specified by TFBs. (A) Fitness benefits gained from rewiring the synthetic TFB are a function of its regulation, genetic background, and environment. A synthetic TFB (TFBx) was synthesized by transferring TFBa/e clade-specific residues to the TFBd backbone to simulate acquisition of a novel TFB through gene conversion across members of this expanded gene family. Two plasmids harboring a copy of TFBx transcriptionally fused to either the tfbD or tfbE promoter (PtfbD or PtfbE) were transformed into the Δura3 (WT), ΔtfbD, and ΔtfbE genetic backgrounds (altogether six strains). The fitness consequences of introducing TFBx into the resident GRN were evaluated by analyzing growth characteristics of these six strains at 37 and 25°C. This revealed that all controlled parameters—regulation of TFBx, genetic background of the host, and environment—significantly influenced how TFBx altered the host phenotype. Remarkably, the fitness contributions of TFBx were significantly greater at 37°C when it was expressed under the control of PtfbE. (B) Novel regulatory programs resulting from incorporation of the synthetic TFB into GRN are conditional on its regulation and environmental context. Global transcriptional changes of the six strains described above and the control (each of the hosts harboring just the plasmid vector) were determined during growth at 25 and 37°C by hybridizing fluorescently labeled total RNA to Agilent custom design 8X60K tiling arrays as described in Materials and methods. Δura3 (WT), ΔtfbD (tfbD knockout); PtfbD-tfbXtfbD: plasmid carrying synthetic TFB controlled by tfbD promoter; PtfbE-tfbX: plasmid carrying synthetic TFB controlled by tfbE promoter; control: plasmid without the synthetic TFB construct. Significant changes in transcript levels were identified using significance analysis for microarrays (SAM) within the MEV package (Saeed et al, 2006). The rewiring via transcriptional fusion to PtfbD resulted in differential expression of 67 genes at 25°C and 82 genes at 37°C. These data demonstrate that incorporation of TFBx into the GRN generated both environment-dependent (see genes differentially regulated by PtfbD-TFBx) and -independent (genes enriched for thioredoxin-related functions (purple bars)) novel regulatory programs. Notably, the differentially regulated genes also included two TBPs (TBPc and TBPd—indicated with green bars adjacent to the heatmap), numerous transcriptional regulators (blue bars), and putative non-coding RNAs (orange bars) (Koide et al, 2009), implicating additional secondary mechanisms by which rewiring of the synthetic TFB had completely altered the transcriptional network. (C) Fitness landscape of the synthetic TFB is unlike those specified by any of the resident naturally evolved TFBs. Analysis of growth characteristics across 10 environmental conditions revealed that the synthetic TFB encoded completely novel fitness landscapes that bore no similarity to fitness landscapes of any of the parents (TFBd or TFBa/e) (Supplementary Table S8). This illustrates the striking ability of the TFB network to generate completely novel niche adaptation capability. (D) Transcriptional fusion to PtfbE consistently improves fitness conferred by the synthetic TFB across all environments. Although the transcriptional analysis revealed that transcription fusion to PtfbD altered the regulatory programs in a unique manner, transcriptional fusion to PtfbE was consistently associated with enhanced fitness. (E) Replacing the native promoter of tfbD with PtfbE improves fitness. Relative fitness contributions of TFBd (log2 ratios) across seven environmental conditions is higher when it is under the transcriptional control of PtfbE relative to when it is transcribed from its native promoter. This result confirms that changes to regulation of a TFB alone can significantly improve fitness.
Figure 6
Figure 6
Overexpression of tfbE results in biofilm formation. Phase contrast microscopy (oil immersion, × 100) of WT H. salinarum NRC-1 illustrates its typical cellular morphology in liquid cultures (A). In contrast, overexpression of tfbE resulted in formation of white flocculent structures in liquid cultures that were discovered to be because of cell clumping (B). Addition of DNase I to culture media had no effect on the WT but resulted in disassembly of these clumps, suggesting that DNA is a major component of the matrix that holds cells together within the clumps (C: NRC-1+DNase ( × 100); D: Pfer-tfbE/NRC-1+DNase ( × 100).

References

    1. Alm E, Huang K, Arkin A (2006) The evolution of two-component systems in bacteria reveals different strategies for niche adaptation. PLoS Comput Biol 2: e143. - PMC - PubMed
    1. Alper H, Moxley J, Nevoigt E, Fink GR, Stephanopoulos G (2006) Engineering yeast transcription machinery for improved ethanol tolerance and production. Science 314: 1565–1568 - PubMed
    1. Baliga NS, Bjork SJ, Bonneau R, Pan M, Iloanusi C, Kottemann MC, Hood L, DiRuggiero J (2004) Systems level insights into the stress response to UV radiation in the halophilic archaeon Halobacterium NRC-1. Genome Res 14: 1025–1035 - PMC - PubMed
    1. Bandyopadhyay S, Mehta M, Kuo D, Sung MK, Chuang R, Jaehnig EJ, Bodenmiller B, Licon K, Copeland W, Shales M, Fiedler D, Dutkowski J, Guenole A, van Attikum H, Shokat KM, Kolodner RD, Huh WK, Aebersold R, Keogh MC, Krogan NJ et al. (2010) Rewiring of genetic networks in response to DNA damage. Science 330: 1385–1389 - PMC - PubMed
    1. Bare JC, Koide T, Reiss DJ, Tenenbaum D, Baliga NS (2010) Integration and visualization of systems biology data in context of the genome. BMC Bioinformatics 11: 382. - PMC - PubMed

Publication types

MeSH terms

Associated data