. 2011 Nov 22:2:545.
doi: 10.1038/ncomms1562.

Metabolomic high-content nuclear magnetic resonance-based drug screening of a kinase inhibitor library

Affiliations

Metabolomic high-content nuclear magnetic resonance-based drug screening of a kinase inhibitor library

Stefano Tiziani et al. Nat Commun. .

Abstract

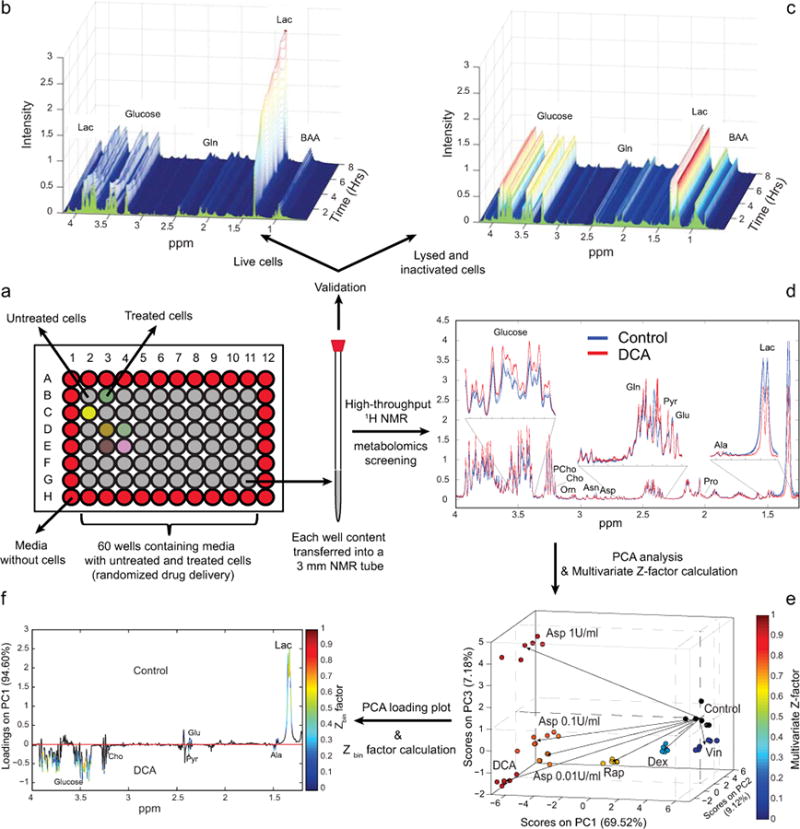
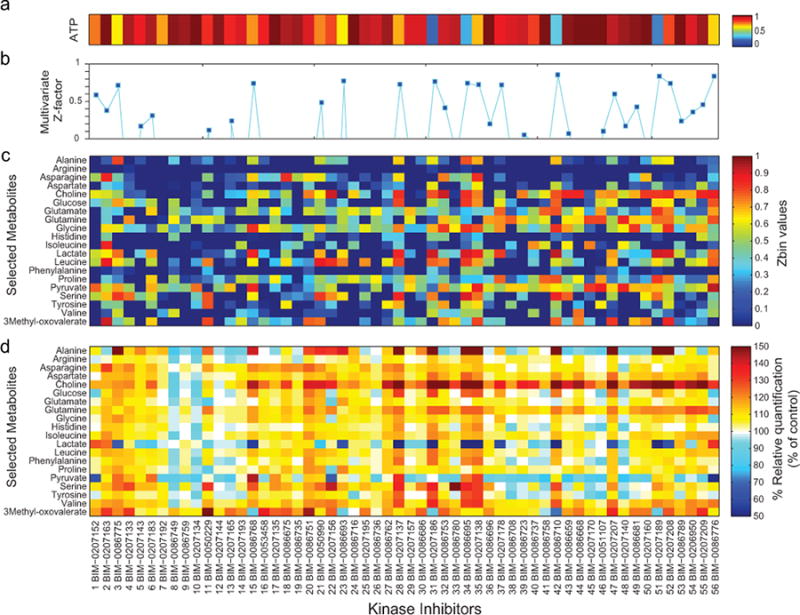
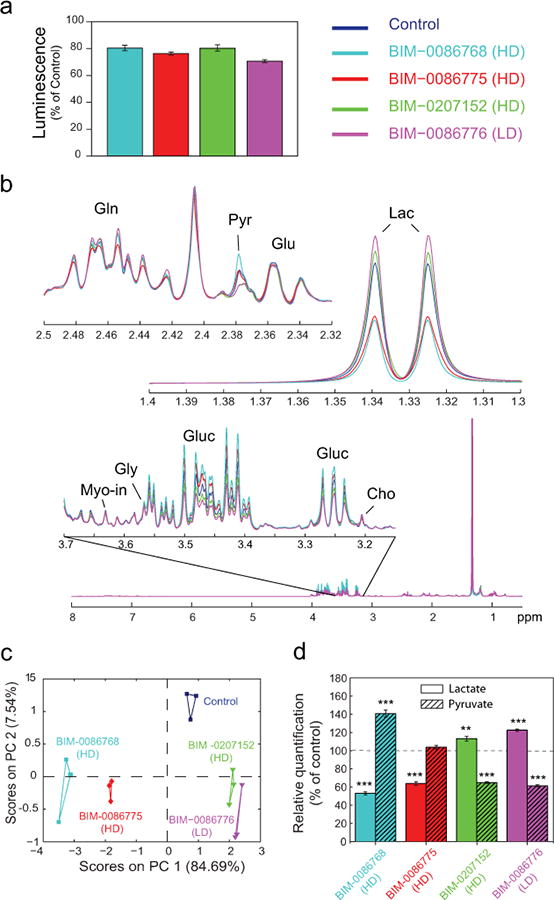
Metabolism is altered in many highly prevalent diseases and is controlled by a complex network of intracellular regulators. Monitoring cell metabolism during treatment is extremely valuable to investigate cellular response and treatment efficacy. Here we describe a nuclear magnetic resonance-based method for screening of the metabolomic response of drug-treated mammalian cells in a 96-well format. We validate the method using drugs having well-characterized targets and report the results of a screen of a kinase inhibitor library. Four hits are validated from their action on an important clinical parameter, the lactate to pyruvate ratio. An eEF-2 kinase inhibitor and an NF-kB activation inhibitor increased lactate/pyruvate ratio, whereas an MK2 inhibitor and an inhibitor of PKA, PKC and PKG induced a decrease. The method is validated in cell lines and in primary cancer cells, and may have potential applications in both drug development and personalized therapy.


Figures

Figure 1
Figure 1. Validation and workflow for NMR-based metabolomic drug screening
(a) The cells are seeded and treated in a 96-well plate. At the end of the 24 hours treatment period, cells are lysed and their metabolism quenched by combined ultrasonication and addition of SDS-d25. The well content is then transferred into a 3 mm NMR tube. To validate the quenching of any residual enzymatic activity, metabolic changes were monitored by NMR in live cells (b) and cells lysed and inactivated by addition of SDS-d25 and ultrasonication (c). 1D NMR spectra were acquired every 30 minutes for a total of eight hours. (d) 1H-NMR spectra showing the metabolomic perturbations induced in CCRF-CEM cells after 24 hours of drug treatment (dexamethasone (Dex), rapamycin, (Rap) dichloroacetate (DCA), vincristine (Vin) and three different doses of asparaginase (A1, 1 U/ml; A01, 0.1 U/ml; A001, 0.01 U/ml)). Overlay of 6 replicate spectra (1.3-4 ppm section) per treatment condition (with and without DCA treatment) highlights the degree of reproducibility. The metabolic changes detected determine a good separation between the different treatment groups, as shown in the three dimensional scores plot (e), obtained from the PCA of the CPMG NMR spectra. Each treatment group is color-coded according to the multivariate Z-factor value (color bar) obtained by the pair-wise PCA comparison of each drug treatment vs. solvent control (Dex (Z = 0.15), DCA (Z = 0.91), Rap (Z = 0.74), Vin (Z = -1.97), A1 (Z = 0.91), A01 (Z = 0.86), A001 (Z = 0.84)). (f) PCA loadings plot and the superimposed Zbin values identify both the contribution and the Z-factor values of every bin of NMR spectra from the comparison of control and DCA intervention (Lac, lactate; Ala, alanine; Pro, proline; Glu, glutamate; Pyr, pyruvate; Gln, glutamine; Asp, aspartate; Asn, asparagine; Orn, ornithine; Cho, choline; PCho, phosphocholine).
Figure 2
Figure 2. Comparison of different NMR pulse sequences
Full spectra and expanded sections (07-1.1 and 6.6-7.5 ppm) of 1H NMR spectra acquired using (a) 1D 1H NMR, (b) Carr-Purcell-Meiboom-Gill (CPMG) spin echo pulse sequence and (c) by projecting the acquired 2D JRES (pJRES). Spectra were acquired on CCRF-CEM leukemia cells treated with solvent control (Control), dexamethasone (Dex, 50nM), dichloroacetate (DCA, 20mM), rapamycin (Rap, 100nM) vincristine (Vin, 1nM) and asparaginase at three different doses (A1, 1 u/ml; A01, 0.1 u/ml; A001, 0.01 u/ml) following cell lysis and metabolism inactivation via addition of SDS and ultrasonication. The spectra acquired using the aforementioned pulse sequences show important alterations on the resonance intensities of selected metabolites (Ile, isoleucine; Leu, leucine; Val, valine; Tyr, tyrosine, His histidine; Phe, phenylalanine) as highlighted by the PCA scores plots obtained from analysis of spectra acquired using (d) 1D (PC1 versus PC3), (e) CPMG (PC1 versus PC3) and (f) JRES pulse sequences (PC1 versus PC2) on CCRF-CEM cells with and without drug treatments.
Figure 3
Figure 3. NMR-based metabolomic screening of drug treatment in acute myeloid leukemia primary cells
(a) Difference spectra obtained by subtracting the average NMR spectrum of the medium, incubated without the cells in the 96-well plate subtracted from the average NMR spectra of AML primary cells with and without 24 hours of 100 nM Rap or 1 U/ml Asp drug treatment. (b) PCA scores plot (PC1 versus PC2) color-coded according to the multivariate Z-factor values foreach treatment group (Rap (Z = -0.90), A1 (Z = 0.83), A01 (Z = 0.77) and A001 (Z = 0.42)). (c-d) PCA loadings plots and the superimposed Zbin values identify both the contribution and the Z-factor values of each bin of NMR spectra from a pairwise comparison of control and drug intervention ((c) rapamycin and (d) asparaginase treatments) (Ile, isoleucine; Lac, lactate; Ala, alanine; Glu, glutamate; Pyr, pyruvate; Gln, glutamine; Asp, aspartate; Asn, asparagine; Orn, ornithine; Lys, lysine; Cho, choline; Gly, glycine).
Figure 4
Figure 4. High-content NMR-based metabolomic screening in adherent cell lines
PCA scores plots (PC1 versus PC2) obtained from the analysis of the 1H-NMR spectra of (a) human ovarian carcinoma cell line (SKOV-3) after 24 hours of treatment with different types of drugs and (b) human epithelial carcinoma cell lines (HeLa) after 24 hours of microRNAs (miRNA-16 and miRNA-121) treatment. Each treatment-group on the PCA scores plots is color-coded according to the multivariate Z-factor value (color bar) obtained from the pair-wise PCA comparison of treatment vs. control for SKOV-3 (Dex (Z = -5.83), DCA (Z = 0.45), Rap (Z = -3.07), Vin(Z = -1.84), A1(Z = 0.70), A01(Z = 0.01), A001(Z = 0.24)) and HeLa (mir-16 (Z = 0.34) and mir-121 (Z = -0.55)) cell lines.
Figure 5
Figure 5. NMR-based metabolomic screening of a library of KIs
(a) ATP assay was used to measure the cell viability of CCRF-CEM cells following 24 hours of treatment with 56 KIs (1-56 BIM). The final concentration of each drug treatment was 1 μM. The mean luminescence values of cells treated with KI were normalized to the average ATP value for untreated cells (solvent control). (b) Principal component analysis was performed on the 1H NMR spectra acquired in triplicates and a multivariate Z-factor value was calculated for each KI. For a subset of all the observed metabolites we determined the Zbin values (c) and their relative concentration (d, as percent of control).
Figure 6
Figure 6. Metabolic modulation induced in CCRF-CEM cells by four KI hits
Four KIs found to cause similar drop (by ∼20%) of ATP values in CCRF-CEM cells were selected. The drugs eEF-2 kinase inhibitor (BIM-0207152), MK2 inhibitor (BIM-0086775) and an inhibitor of PKA, PKC and PKG (BIM-0086768) were administered at the high dose (1 μM), and NF-KB activation inhibitor (BIM-0086776) at low dose (0.1 μM). (a) ATP assay (as % of control) following KI treatments is reported as the mean values (bars) +/- SEM (error bars; N=3).(b) Representative sections of average 1H NMR spectra acquired on CCRF-CEM cells with and without KI treatment are expanded (Gln, glutamine; Pyr, pyruvate; Glu, glutamate; Cho, choline; Gluc, glucose; Gly, glycine; Myo-in, myo-inositol). (c) Principal component analysis (PC1 versus PC2) was performed on the 1H NMR spectra of treated and untreated CCRF-CEM cells acquired in triplicates. (d) Relative concentrations of lactate and pyruvate calculated as percent of control are reported as the mean values (bars) +/- SEM (error bars; N=3). Statistical comparison between data obtained from untreated and KIs treatment was performed using an unpaired Student's t-test (statistical significance: *P< .05, **P< .01, and ***P< .001).

References

    1. Duarte IF, et al. Analytical Approaches toward Successful Human Cell Metabolome Studies by NMR Spectroscopy. Anal Chem. 2009;81:5023–5032. - PubMed
    1. Abraham VC, Taylor DL, Haskins JR. High content screening applied to large-scale cell biology. Trends Biotechnol. 2004;22:15–22. - PubMed
    1. Baker M. Academic screening goes high-throughput. Nat Methods. 2010;7:787–792.
    1. Neumann B, et al. High-throughput RNAi screening by time-lapse imaging of live human cells. Nat Methods. 2006;3:385–390. - PubMed
    1. Zanella F, Lorens JB, Link W. High content screening: seeing is believing. Trends Biotechnol. 2010;28:237–245. - PubMed

Publication types

MeSH terms

Substances