. 2013 Mar;34(3):698-712.
doi: 10.1002/hbm.21467. Epub 2011 Nov 23.

Segregated and overlapping neural circuits exist for the production of static and dynamic precision grip force

Affiliations

Segregated and overlapping neural circuits exist for the production of static and dynamic precision grip force

Kristina A Neely et al. Hum Brain Mapp. 2013 Mar.

Abstract

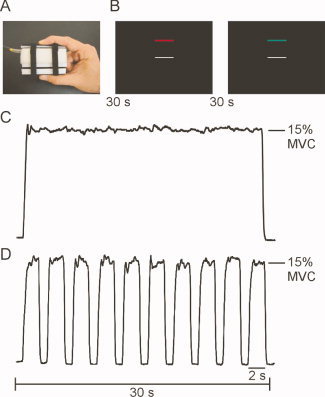
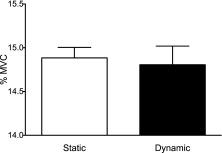
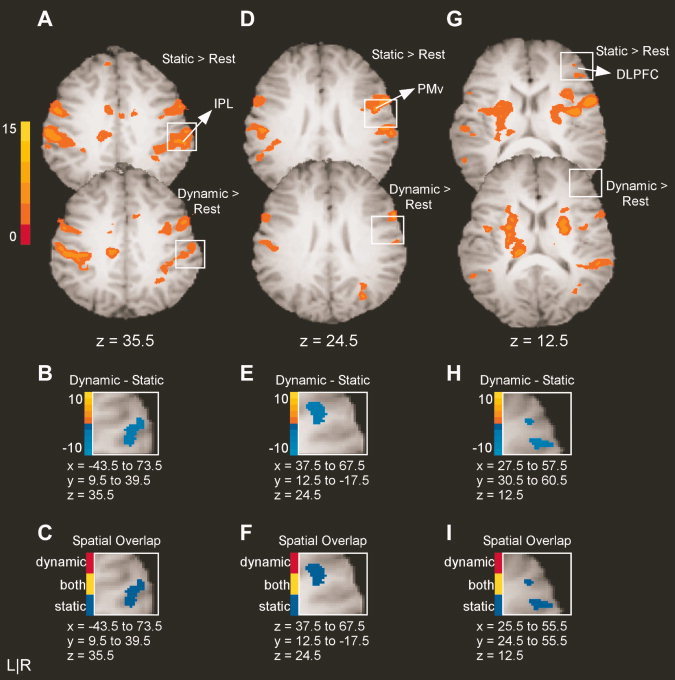
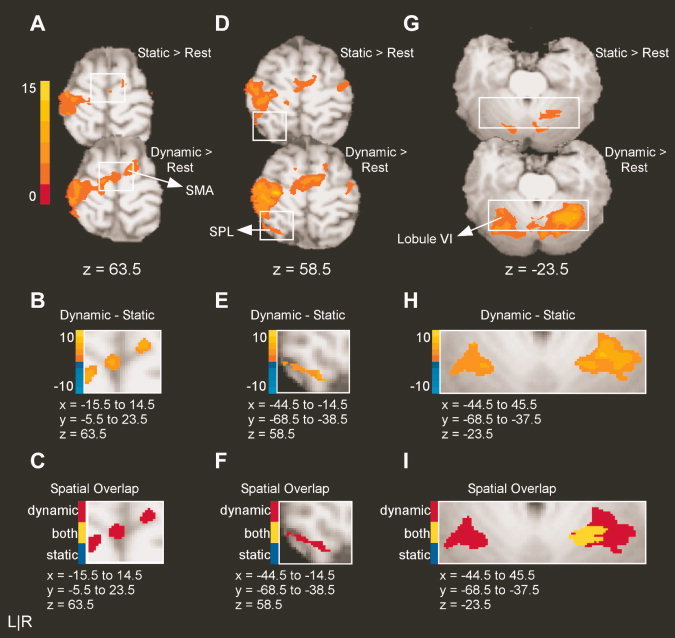
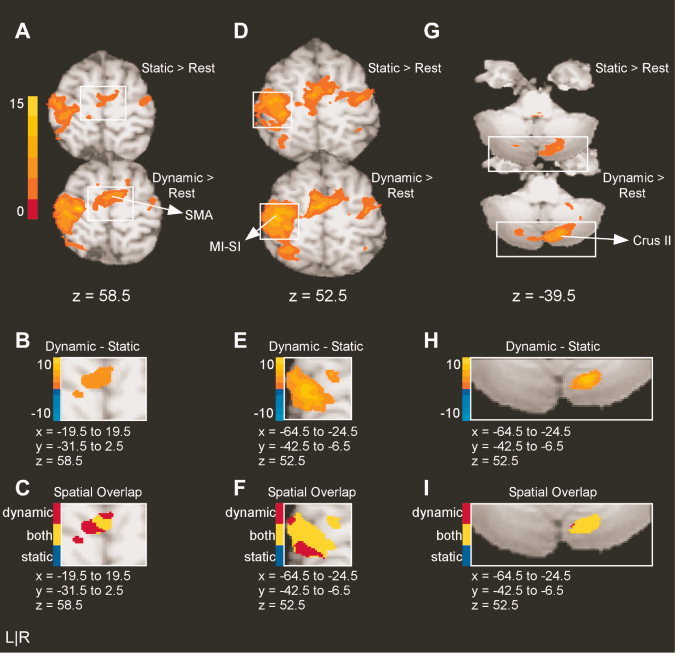
A central topic in sensorimotor neuroscience is the static-dynamic dichotomy that exists throughout the nervous system. Previous work examining motor unit synchronization reports that the activation strategy and timing of motor units differ for static and dynamic tasks. However, it remains unclear whether segregated or overlapping blood-oxygen-level-dependent (BOLD) activity exists in the brain for static and dynamic motor control. This study compared the neural circuits associated with the production of static force to those associated with the production of dynamic force pulses. To that end, healthy young adults (n = 17) completed static and dynamic precision grip force tasks during functional magnetic resonance imaging (fMRI). Both tasks activated core regions within the visuomotor network, including primary and sensory motor cortices, premotor cortices, multiple visual areas, putamen, and cerebellum. Static force was associated with unique activity in a right-lateralized cortical network including inferior parietal lobe, ventral premotor cortex, and dorsolateral prefrontal cortex. In contrast, dynamic force was associated with unique activity in left-lateralized and midline cortical regions, including supplementary motor area, superior parietal lobe, fusiform gyrus, and visual area V3. These findings provide the first neuroimaging evidence supporting a lateralized pattern of brain activity for the production of static and dynamic precision grip force.


Figures

Figure 1
Figure 1
The precision grip apparatus, visual display, and exemplar force traces for the static and dynamic tasks. A: The precision grip apparatus. B: The visual display contained two horizontal bars presented against a high contrast black background. The target bar (red/green) was stationary across all trials, whereas the white force bar moved to provide the participant with real‐time visual feedback about their force. C: In the static task, participants produced constant force for 30 s. In each task, each 30 s force interval was followed by 30 s of rest. D: In the dynamic task, participants produced 10, 2 s force pulses separated by 1 s of rest.
Figure 2
Figure 2
Mean force (as a percentage of MVC) in the static and dynamic tasks. Mean force was not different across tasks. Error bars represent one standard deviation.
Figure 3
Figure 3
Results from the voxelwise analysis for areas with greater BOLD activity in the static task than in the dynamic task. A: The activation maps for the static minus rest and the dynamic minus rest contrasts for right IPL. The intensity bar ranges from t = 0 to t = 15 with a group activation threshold of p < 0.05, corrected. B: The voxelwise comparison of the static versus dynamic task (p < 0.05, corrected). The voxels shown in panel B correspond to the area encompassed by the white box in panel A. The intensity bar ranges from t = −10 to t = 10, where positive voxels have greater BOLD activation in the dynamic task than in the static task and negative voxels have greater BOLD activation in the static task relative to the dynamic task. C: The spatial overlap between static and dynamic tasks. Voxels identified with task differences in B are defined as unique to the static task (blue), unique to the pulse task (red), or active in both tasks (yellow). Note that the slices shown in A, B, and C are from the same axial slice for each region. DF and GI reflect the same analysis approach for PMv and DLPFC.
Figure 4
Figure 4
Results from the voxelwise analysis for areas with greater BOLD activity in the dynamic task than in the static task. A: The activation maps for the static minus rest and the dynamic minus rest contrasts for SMA. The intensity bar ranges from t = 0 to t = 15 with a group activation threshold of p < 0.05, corrected. B: The voxelwise comparison of the static versus dynamic task (p < 0.05, corrected). The voxels shown in panel B correspond to the area encompassed by the white box in panel A. The intensity bar ranges from t = −10 to t = 10, where positive voxels have greater BOLD activation in the dynamic task than in the static task and negative voxels have greater BOLD activation in the static task relative to the dynamic task. C: The spatial overlap between static and dynamic tasks. Voxels identified with task differences in B are defined as unique to the static task (blue), unique to the pulse task (red), or active in both tasks (yellow). Note that the slices shown in A, B, and C are from the same axial slice for each region. DF and GI reflect the same analysis approach for left SPL and left Lobule VI of the cerebellum.
Figure 5
Figure 5
Results from the voxelwise analysis for areas common to both tasks. A: The activation maps for the static minus rest and the dynamic minus rest contrasts for SMA. The intensity bar ranges from t = 0 to t = 15 with a group activation threshold of p < 0.05, corrected. B: The voxelwise comparison of the static versus dynamic task (p < 0.05, corrected). The voxels shown in panel B correspond to the area encompassed by the white box in panel A. The intensity bar ranges from t = −10 to t = 10, where positive voxels have greater BOLD activation in the dynamic task than in the static task and negative voxels have greater BOLD activation in the static task relative to the dynamic task. C: The spatial overlap between static and dynamic tasks. Voxels identified with task differences in B are defined as unique to the static task (blue), unique to the pulse task (red), or active in both tasks (yellow). Note that the slices shown in A, B, and C are from the same axial slice for each region. DF and GI reflect the same analysis approach for left MI‐SI, and right Crus II of the cerebellum.

References

    1. Andersen RA, Asanuma C, Essick G, Siegel RM ( 1990): Corticocortical connections of anatomically and physiologically defined subdivisions within the inferior parietal lobule. J Comp Neurol 296: 65–113. - PubMed
    1. Ashe J ( 1997): Erratum to Force and the motor cortex: [Behavioural Brain Research 86 (1997) 1–15]. Behav Brain Res 87: 253–269. - PubMed
    1. Astafiev SV, Shulman GL, Stanley CM, Snyder AZ, Van Essen DC, Corbetta M ( 2003): Functional organization of human intraparietal and frontal cortex for attending, looking, and pointing. J Neurosci 23: 4689–4699. - PMC - PubMed
    1. Bagesteiro LB, Sainburg RL ( 2003): Nondominant arm advantages in load compensation during rapid elbow joint movements. J Neurophysiol 90: 1503–1513. - PMC - PubMed
    1. Bagesteiro LB, Sainburg RL ( 2005): Interlimb transfer of load compensation during rapid elbow joint movements. Exp Brain Res 161: 155–165. - PMC - PubMed

Publication types

LinkOut - more resources