. 2012 Jan 1;4(1):a005991.
doi: 10.1101/cshperspect.a005991.

Signaling by sensory receptors

Affiliations

Signaling by sensory receptors

David Julius et al. Cold Spring Harb Perspect Biol. .

Abstract

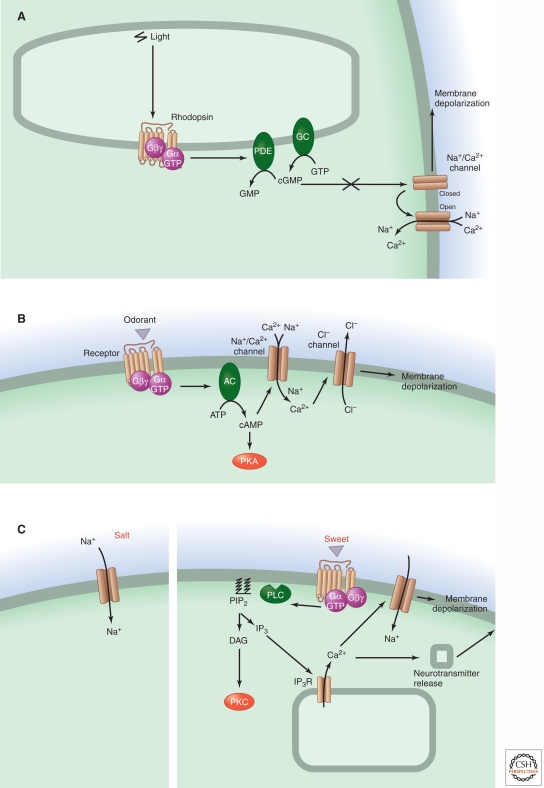
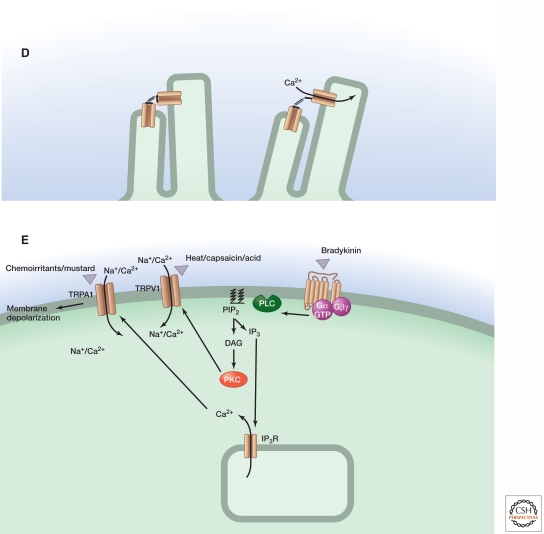
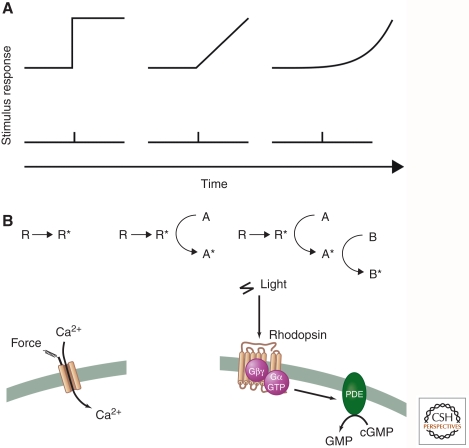
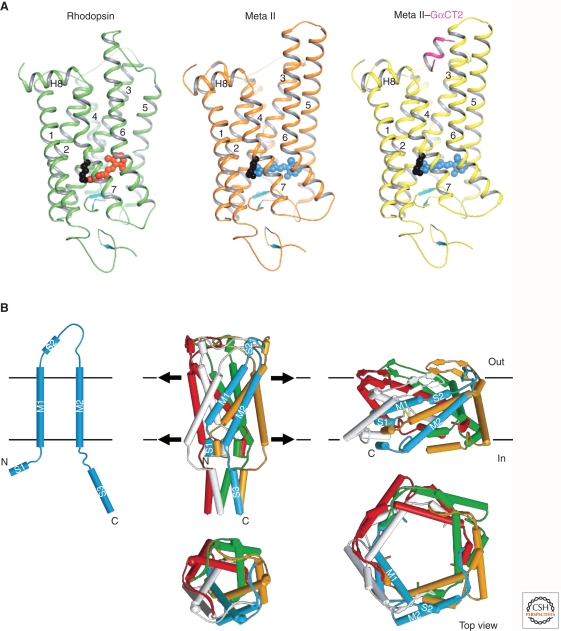
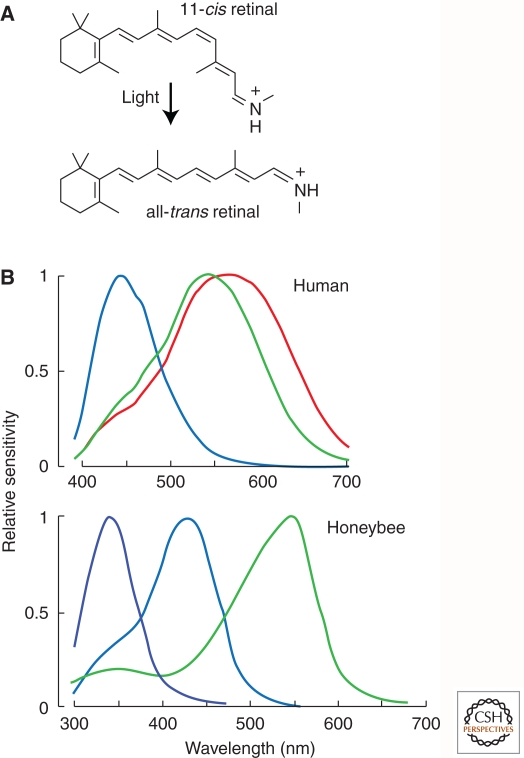
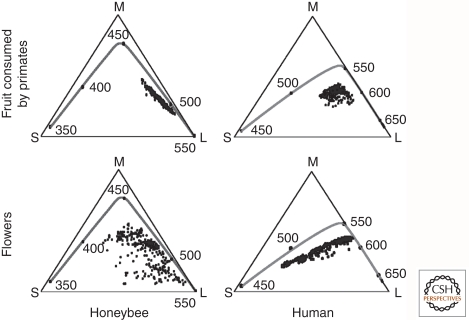
Sensory systems detect small molecules, mechanical perturbations, or radiation via the activation of receptor proteins and downstream signaling cascades in specialized sensory cells. In vertebrates, the two principal categories of sensory receptors are ion channels, which mediate mechanosensation, thermosensation, and acid and salt taste; and G-protein-coupled receptors (GPCRs), which mediate vision, olfaction, and sweet, bitter, and umami tastes. GPCR-based signaling in rods and cones illustrates the fundamental principles of rapid activation and inactivation, signal amplification, and gain control. Channel-based sensory systems illustrate the integration of diverse modulatory signals at the receptor, as seen in the thermosensory/pain system, and the rapid response kinetics that are possible with direct mechanical gating of a channel. Comparisons of sensory receptor gene sequences reveal numerous examples in which gene duplication and sequence divergence have created novel sensory specificities. This is the evolutionary basis for the observed diversity in temperature- and ligand-dependent gating among thermosensory channels, spectral tuning among visual pigments, and odorant binding among olfactory receptors. The coding of complex external stimuli by a limited number of sensory receptor types has led to the evolution of modality-specific and species-specific patterns of retention or loss of sensory information, a filtering operation that selectively emphasizes features in the stimulus that enhance survival in a particular ecological niche. The many specialized anatomic structures, such as the eye and ear, that house primary sensory neurons further enhance the detection of relevant stimuli.


Figures

Figure 1.
Figure 1.
Comparison of sensory signaling systems for vision, olfaction, hearing and balance, taste, and pain/thermosensation. The events underlying signal transduction are shown schematically for (A) rod and cone photoreception; (B) olfaction in the main olfactory epithelium; (C) salt (left) and sweet (right) taste; (D) hearing and balance; and (E) pain/thermosensation. Schematics A–E refer to vertebrates. The final step in olfactory signaling consists of the calcium-dependent opening of anion channel TMEM16B, although recent work suggests that the resulting anion current plays only a minor role in olfactory signal transduction (Billig et al. 2011). For pain/thermosensation mediated by TRPV1, the figure shows inflammatory agents (extracellular protons, bioactive lipids, peptides, and neurotrophins) acting to enhance channel opening either as direct allosteric modulators of TRPV1 or through second-messenger signaling pathways. In auditory and vestibular hair cell bundles, it is not known whether transduction channels reside at both ends or at only one end of the extracellular elastic elements (tip links); in panel D the channels are shown at both ends.
Figure 1.
Figure 1.
Comparison of sensory signaling systems for vision, olfaction, hearing and balance, taste, and pain/thermosensation. The events underlying signal transduction are shown schematically for (A) rod and cone photoreception; (B) olfaction in the main olfactory epithelium; (C) salt (left) and sweet (right) taste; (D) hearing and balance; and (E) pain/thermosensation. Schematics A–E refer to vertebrates. The final step in olfactory signaling consists of the calcium-dependent opening of anion channel TMEM16B, although recent work suggests that the resulting anion current plays only a minor role in olfactory signal transduction (Billig et al. 2011). For pain/thermosensation mediated by TRPV1, the figure shows inflammatory agents (extracellular protons, bioactive lipids, peptides, and neurotrophins) acting to enhance channel opening either as direct allosteric modulators of TRPV1 or through second-messenger signaling pathways. In auditory and vestibular hair cell bundles, it is not known whether transduction channels reside at both ends or at only one end of the extracellular elastic elements (tip links); in panel D the channels are shown at both ends.
Figure 2.
Figure 2.
Schematic representation of temporal response profiles for single or multicomponent transduction systems. (A) Time course of stimulus-evoked responses for transduction systems consisting of zero, one, or two enzymatic stages of amplification. (B) For each system, the schematic diagram shows the flow of information in the transduction system, with R and R* representing the sensory receptor molecule in the inactive and active states, respectively. (Left panel) Here, there are no transduction components beyond the receptor itself, as in the case of a sensory ion channel, where activation is nearly instantaneous. (Middle panel) Here, the active receptor functions as a catalyst and converts inactive molecules of A to their active derivatives A*, which accumulate linearly with time following receptor activation. (Right panel) Here, the active derivative A* functions as a catalyst to convert inactive molecules of B to their active derivatives B*, resulting in second-order response kinetics. The left panel represents a mechanosensory system, and the right panel represents vertebrate phototransduction, as diagrammed below.
Figure 3.
Figure 3.
3D structures of rhodopsin and a mechanically gated ion channel. (A) Ribbon diagram of rhodopsin in the inactive state with bound 11-cis-retinal (red spheres) compared with the light-activated Metarhodopsin II state containing all-trans-retinal (blue spheres) and Metarhodopsin II state in complex with a peptide (pink) corresponding to the receptor-binding site on the Gα subunit of transducin. Rotation and elongation of light-activated retinal lead to a slight rotational tilt of transmembrane helices 5 and 6, thereby enlarging a crevice at the cytoplasmic side of the receptor in which Gα can dock (Choe et al. 2011). (B) Bacterial mechanosensory ion channel, MscL, showing transmembrane topology of a monomer (top left) and the assembled pentameric channel complex (top middle). Membrane stretch and consequent changes in tension at the membrane–protein interface produce structural rearrangements that result in compression of the channel and expansion of the central ion permeation pore, as depicted in the side and top views (Kung 2005).
Figure 4.
Figure 4.
Color vision in humans and honeybees. (A) Photoisomerization of retinal from 11-cis to all-trans, the photochemical event that initiates receptor activation in vertebrate and invertebrate photoreceptors. (B) Spectral sensitivities of human cone photoreceptors and honeybee rhabdomeric photoreceptors. (Adapted from Osorio and Vorobyev 2008; reprinted, with permission, from Elsevier © 2008.)
Figure 5.
Figure 5.
Chromaticity diagrams for humans and honeybees. The triangles represent a plane within a 3D receptor space, with each vertex corresponding to the point at which the plane intersects an axis representing the degree of excitation of one receptor type. (S) Short-wavelength receptor axis; (M) medium-wavelength receptor axis; (L) long-wavelength receptor axis. The small black circles within the triangles represent the chromaticities of a set of fruits that are consumed by primates (upper panels) or a set of flower petals (lower panels). The line within each chromaticity diagrams represents the locus of spectrally pure lights, with black circles and the adjacent numbers marking steps of 50 nm. (Adapted from Osorio and Vorobyev 2008; reprinted, with permission, from Elsevier © 2008.)

References

    1. Abrahamson EW, Japar SM 1972. Principles of the interaction of light and matter. In Handbook of sensory physiology. VII/1: Photochemistry of vision (ed. Dartnall HJA), pp. 1–32 Springer-Verlag, Berlin
    1. Arshavsky VY, Lamb TD, Pugh EN 2002. G proteins and phototransduction. Annu Rev Physiol 64: 153–187 - PubMed
    1. Bakken GS, Krochmal AR 2007. The imaging properties and sensitivity of the facial pit of pitvipers as determined by optical and heat-transfer analysis. J Exp Biol 210: 2801–2810 - PubMed
    1. Basbaum AI, Bautista DM, Scherrer G, Julius D 2009. Cellular and molecular mechanisms of pain. Cell 139: 267–284 - PMC - PubMed
    1. Baylor DA, Matthews G, Yau KW 1980. Two components of electrical dark noise in toad retinal rod outer segments. J Physiol 309: 591–621 - PMC - PubMed

Substances

LinkOut - more resources