. 2011 Dec 19;208(13):2691-703.
doi: 10.1084/jem.20111490. Epub 2011 Nov 21.

Clonal analysis reveals multiple functional defects of aged murine hematopoietic stem cells

Affiliations

Clonal analysis reveals multiple functional defects of aged murine hematopoietic stem cells

Brad Dykstra et al. J Exp Med. .

Abstract

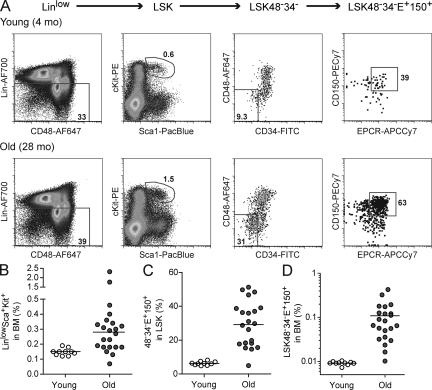
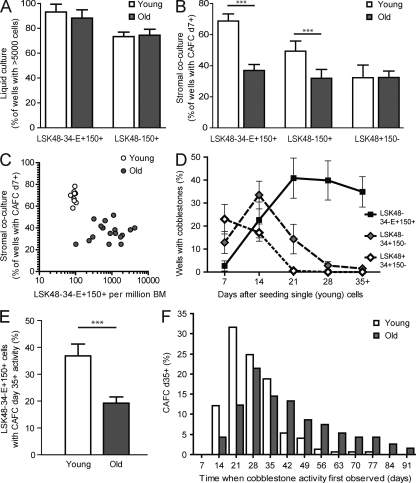
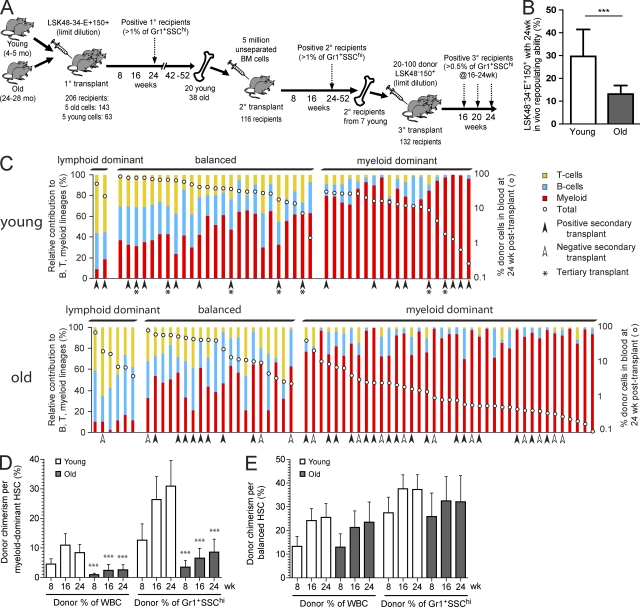
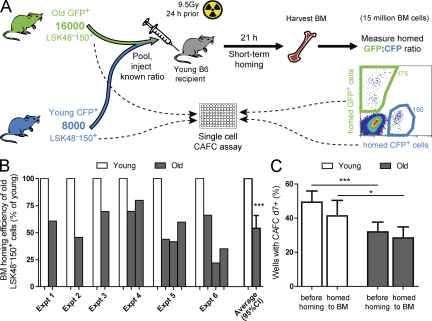
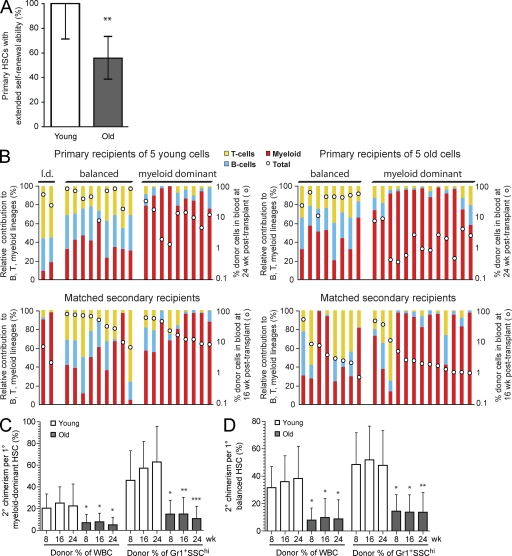
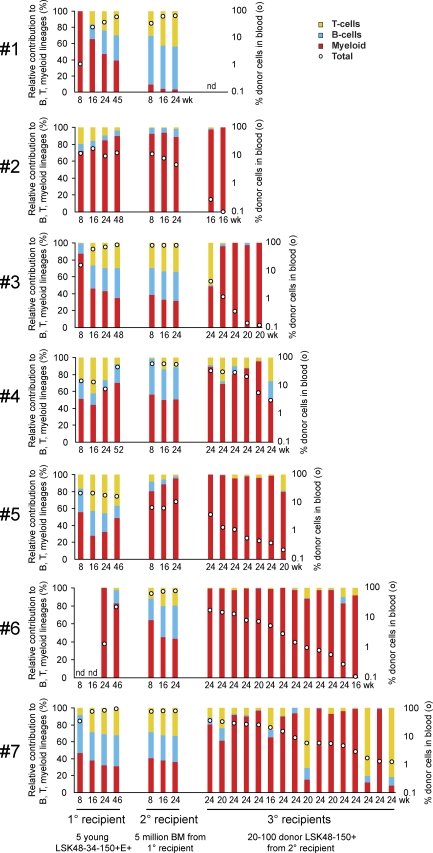
Hematopoietic stem cell (HSC) populations change with aging, but the extent to which this is caused by qualitative versus quantitative alterations in HSC subtypes is unclear. Using clonal assays, in this study we show that the aging HSC compartment undergoes both quantitative and qualitative changes. We observed a variable increase of HSC pool size with age, accompanied by the accumulation of predominantly myeloid-biased HSCs that regenerate substantially fewer mature progeny than young myeloid-biased HSCs and exhibit reduced self-renewal activity as measured by long-term secondary transplantation. Old HSCs had a twofold reduction in marrow-homing efficiency and a similar decrease in functional frequency as measured using long-term transplantation assays. Similarly, old HSCs had a twofold reduced seeding efficiency and a significantly delayed proliferative response compared with young HSCs in long-term stromal cell co-cultures but were indistinguishable in suspension cultures. We show that these functional defects are characteristics of most or all old HSCs and are not indicative of a nonfunctional subset of cells that express HSC markers. Furthermore, we demonstrate that cells with functional properties of old HSCs can be generated directly from young HSCs by extended serial transplantation, which is consistent with the possibility that they arise through a process of cellular aging.


Figures

Figure 1.
Figure 1.
The frequency of BM cells with HSC markers increases with age but is highly variable between individual old mice. (A) Representative FACS profiles of BM from young and old mice. BM from a young (4 mo) and an old (28 mo) mouse was collected and stained with antibodies specific for HSC markers as described in Materials and methods. Equal numbers of events (4.5 × 10⁵) are shown for each mouse. Viable cells were first selected based on their forward and side scatter properties and their exclusion of propidium iodide. Lineage-low (Linlo) cells were then selected as shown in the leftmost panel, followed by gating for cells double positive for Sca1 and cKit to identify the LSK population. The LSK population was enriched further by selecting those cells negative for CD34 and CD48 and positive for EPCR (E+) and CD150 to obtain the stem cell–enriched LSK4834E+150+ population. (B and C) Percentage of LinloSca1+cKit+ (LSK) in BM and percentage of CD48CD34EPCR+CD150+ within the LSK population of 10 individual young (4–5 mo) and 22 old (24–28 mo) mice. Dots represent individual mice, and horizontal lines indicate median values. (D) Mean BM frequencies of LSK4834E+150+ cells in the same 10 young and 22 old mice.
Figure 2.
Figure 2.
Old and young BM cells with HSC markers have similar clonogenic ability in liquid culture but have reduced activity in stromal co-cultures. (A) 60–120 purified LinloSca1+cKit+CD48CD34EPCR+CD150+ (LSK4834E+150+) and LSK48150+ cells from each of five young or six old mice were seeded individually as single cells into liquid cultures supplemented with stem cell factor and IL-11. Shown is the mean proportion of single purified cells from the individually tested young and old mice that generated clones of at least 5,000 cells within 2 wk of culture. (B) 60–120 purified LSK4834E+150+, LSK48150+, and LSK48+150 cells from young or old mice were seeded as single cells onto FBMD stroma and scored weekly for the presence or absence of cobblestone areas. Shown is the mean proportion of single purified cells from individually tested young (n = 7–9) and old (n = 12–20) mice that generated cobblestone areas at day 7 or later (CAFCd7+). (C) Dots represent individual young (n = 9) or old (n = 19) mice and show the size of the LSK4834E+150+ pool (as described in Fig. 1) and the clonogenic efficiency in stromal co-culture (as shown in B). (D) LSK4834E+150+ (HSC containing), LSK4834+150 (more primitive MPPs), and LSK48+34+150 (less primitive MPPs) were isolated from young BM and seeded individually onto FBMD stroma and scored weekly for the presence or absence of cobblestone areas, which are characteristic of proliferating primitive cells. Data represent a minimum of 500 wells per cell type from a total of 10 individual young mice. (E) 60 purified LSK4834E+150+ cells from each of 9 young and 19 old mice were seeded individually as single cells onto FBMD stroma and scored weekly for 11–13 wk for the presence or absence of cobblestone areas. Shown is the mean proportion of single purified LSK4834E+150+ cells from the individually tested young and old mice that generated cobblestone areas at any time point day 35 or later (CAFCd35+). (F) Proportion of LSK4834E+150+ cells with CAFCd35+ activity (described in E) that first generated cobblestone areas at the specified time after seeding. P < 0.001 for old (n = 187) versus young (n = 149) CAFCd35+, Mann-Whitney U test. Error bars on all panels represent 95% confidence intervals of the mean. ***, P < 0.001, unpaired two-tailed Student’s t test.
Figure 3.
Figure 3.
The old LSK4834E+150+ HSC pool is reduced in functional frequency and contains an increased proportion of myeloid-dominant HSCs with a lower output per HSC. (A) Summary of serial transplantation experiments designed to test lineage contribution ratio, overall blood cell output, and in vivo self-renewal properties of individual young and old HSCs. Data from primary (1°), secondary (2°), and tertiary (3°) recipients are presented in Figs. 3, 5, and 6, respectively. (B) Five old or young LSK4834E+150+ cells were transplanted into 206 lethally irradiated young recipients, as described in Materials and methods. Positive recipients (46/63 young, 65/143 old) were defined as those with >1% donor contribution to circulating granulocytes (Gr-1+SSChi) at 24 wk after transplant, and functional HSC frequency was estimated via limiting dilution calculation. Calculated HSC frequencies were 1 in 3.8 and 1 in 8.3 for young and old LSK4834E+150+ cells, respectively. Error bars represent 95% confidence interval. ***, P < 0.001, likelihood ratio test. (C) Relative lineage contribution and overall donor contribution levels in all positive primary recipients. Positive recipients (46 young and 65 old) were classified as myeloid dominant, balanced, or lymphoid dominant based on the relative donor contribution ratio to circulating B, T, and myeloid cells at 24 wk after transplant, as described in Materials and methods. Each bar represents a positive mouse, and the red, blue, and yellow segments represent the relative donor contributions to the myeloid, B, and T lineages in the peripheral blood at 24 wk after transplant. Total donor contribution to the peripheral blood is indicated by the white dot for each mouse and is plotted using the logarithmic secondary y axis. Arrowheads indicate those primary recipients that were used as donors for secondary transplants. Asterisks indicate those primary recipients that were used as donors for secondary and tertiary transplants. (D and E) The mean contribution to total peripheral blood or to the granulocyte (Gr-1+SSChi) lineage was determined for myeloid-dominant (young n = 19, old n = 39) or balanced (young n = 25, old n = 20) primary recipients of young or old LSK4834E+150+ HSCs. To determine the donor chimerism per myeloid-dominant or balanced HSC, these mean contributions were corrected for differences in starting HSC frequency by dividing by the mean number of functional HSCs injected per positive recipient (1.79 HSCs per positive young recipient and 1.33 HSCs per positive old recipient). Time is indicated in weeks after transplant. Error bars represent 95% confidence intervals. All pairs were significantly different (***, P < 0.001) at the same time point between young and old for myeloid-dominant HSCs, and no significant differences were found for balanced HSCs (Mann-Whitney U test).
Figure 4.
Figure 4.
LSK48150+ cells from old mice have reduced short-term marrow-homing efficiency compared with LSK48150+ cells from young mice. (A) Setup of short-term homing experiment. Shown here is a representative example (corresponding to experiment 2 in B). (B) Short-term BM-homing efficiency of old relative to young LSK48150+ cells. Results from six independent experiments are shown. In experiments 4–6, more than two distinguishable donor cell types were transplanted simultaneously. (C) CAFC efficiency of young and old LSK48150+ cells before and after homing. 30–120 individual LSK48150+ cells from the old and young donors in B, either freshly isolated or isolated from the BM of short-term homing recipients, were seeded in stromal co-cultures and checked weekly for cobblestone areas. Shown is the mean proportion of single purified cells from 6 young mice and 11 old mice that generated cobblestone areas at day 7 or later (CAFCd7+). Error bars indicate 95% confidence interval of the mean (CI). *, P < 0.05; ***, P < 0.001, two-tailed Student’s t test.
Figure 5.
Figure 5.
Old HSCs exhibit decreased self-renewal activity and smaller secondary clone size when measured by secondary transplantation in vivo. (A) After correcting for the differences in primary HSC frequencies, the proportion of primary HSCs with extensive in vivo self-renewal activity was calculated based on the secondary transplantation results shown in Table I. **, P < 0.01 for corrected proportions (Fishers exact test). Error bars represent corrected 95% confidence interval for original proportions. (B) All positive W41 secondary recipients and their corresponding primary recipients are shown. Colored bars and white dots represent relative donor lineage contribution and absolute donor proportion in the blood, as described for Fig. 3 C. Top panels show individual primary recipients, grouped by relative lineage contribution pattern as in Fig. 3 C. Bottom panels show the positive secondary recipients, arranged so that corresponding primary and secondary recipients are aligned vertically. l.d., lymphoid dominant. (C and D) The mean contribution to total peripheral blood or to the granulocyte lineage in secondary (2°) W41 recipients was calculated per primary (1°) young myeloid-dominant (n = 9), young balanced (n = 9), old myeloid-dominant (n = 13), or old balanced (n = 8) HSC by dividing by the mean number of functional HSCs injected per positive primary recipient (1.79 HSCs per positive young recipient and 1.33 HSCs per positive old recipient). Time is shown as weeks after transplant. Error bars represent 95% confidence intervals. *, P < 0.05; **, P < 0.01; ***, P < 0.001, Mann-Whitney U test.
Figure 6.
Figure 6.
Low-output myeloid-dominant repopulating cells can be generated from young HSCs in an extended serial transplantation setting. 6–12 mo after transplant, regenerated donor LSK48150+ cells were purified from 10 positive secondary recipients, corresponding to 7 positive primary recipients (#1–#7). Purified cells were injected at limiting dilutions (20, 40, or 100 cells) into tertiary recipients, as indicated in Fig. 3 and described in Table II and Materials and methods. Shown here is the donor repopulation kinetics in primary and secondary recipients, as well as all tertiary recipients in which continuing donor-derived hematopoiesis could be detected. Colored bars and white dots represent relative donor lineage contribution and absolute donor proportion in the blood, as described for Fig. 3 C. The groups of four and three bars on the left represent donor blood cell output over time in the primary and secondary recipients, respectively. In cases where pairs of secondary recipients were tested (#2, #3, and #7), the secondary (2°) recipient bars represent the mean donor blood cell output in both secondary mice. The rightmost group of bars represent donor blood cell output in individual positive tertiary (3°) recipients at the time point of final analysis. nd, no donor derived cells detected.

References

    1. Beerman I., Bhattacharya D., Zandi S., Sigvardsson M., Weissman I.L., Bryder D., Rossi D.J. 2010a. Functionally distinct hematopoietic stem cells modulate hematopoietic lineage potential during aging by a mechanism of clonal expansion. Proc. Natl. Acad. Sci. USA. 107:5465–5470 10.1073/pnas.1000834107 - DOI - PMC - PubMed
    1. Beerman I., Maloney W.J., Weissmann I.L., Rossi D.J. 2010b. Stem cells and the aging hematopoietic system. Curr. Opin. Immunol. 22:500–506 10.1016/j.coi.2010.06.007 - DOI - PMC - PubMed
    1. Bennett-Baker P.E., Wilkowski J., Burke D.T. 2003. Age-associated activation of epigenetically repressed genes in the mouse. Genetics. 165:2055–2062 - PMC - PubMed
    1. Breems D.A., Blokland E.A., Neben S., Ploemacher R.E. 1994. Frequency analysis of human primitive haematopoietic stem cell subsets using a cobblestone area forming cell assay. Leukemia. 8:1095–1104 - PubMed
    1. Challen G.A., Boles N.C., Chambers S.M., Goodell M.A. 2010. Distinct hematopoietic stem cell subtypes are differentially regulated by TGF-beta1. Cell Stem Cell. 6:265–278 10.1016/j.stem.2010.02.002 - DOI - PMC - PubMed

Publication types

MeSH terms

Substances