. 2011 Nov;9(11):e1001199.
doi: 10.1371/journal.pbio.1001199. Epub 2011 Nov 15.

Interplay between BRCA1 and RHAMM regulates epithelial apicobasal polarization and may influence risk of breast cancer

Christopher A Maxwell  1 Javier BenítezLaia Gómez-BaldóAna OsorioNúria BonifaciRicardo Fernández-RamiresSylvain V CostesElisabet GuinóHelen ChenGareth J R EvansPooja MohanIsabel CatalàAnna PetitHelena AguilarAlberto VillanuevaAlvaro AytesJordi Serra-MusachGad RennertFlavio LejbkowiczPaolo PeterlongoSiranoush ManoukianBernard PeisselCarla B RipamontiBernardo BonanniAlessandra VielAnna AllavenaLoris BernardPaolo RadiceEitan FriedmanBella KaufmanYael LaitmanMaya DubrovskyRoni MilgromAnna JakubowskaCezary CybulskiBohdan GorskiKatarzyna JaworskaKatarzyna DurdaGrzegorz SukiennickiJan LubińskiYin Yao ShugartSusan M DomchekRichard LetreroBarbara L WeberFrans B L HogervorstMatti A RookusJ Margriet ColleePeter DevileeMarjolijn J LigtenbergRob B van der LuijtCora M AalfsQuinten WaisfiszJuul WijnenCornelis E P van RoozendaalHEBONEMBRACEDouglas F EastonSusan PeockMargaret CookClare OliverDebra FrostPatricia HarringtonD Gareth EvansFiona LallooRosalind EelesLouise IzattCarol ChuDiana EcclesFiona DouglasCarole BrewerHeli NevanlinnaTuomas HeikkinenFergus J CouchNoralane M LindorXianshu WangAndrew K GodwinMaria A CaligoGrazia LombardiNiklas LomanPer KarlssonHans EhrencronaAnna von WachenfeldtSWE-BRCARosa Bjork BarkardottirUte HamannMuhammad U RashidAdriana LasaTrinidad CaldésRaquel AndrésMichael SchmittVolker AssmannKristen StevensKenneth OffitJoão CuradoHagen TilgnerRoderic GuigóGemma AizaJoan BrunetJoan CastellsaguéGriselda MartratAnder UrruticoecheaIgnacio BlancoLaima TihomirovaDavid E GoldgarSaundra BuysEsther M JohnAlexander MironMelissa SoutheyMary B DalyBCFRRita K SchmutzlerBarbara WappenschmidtAlfons MeindlNorbert ArnoldHelmut DeisslerRaymonda Varon-MateevaChristian SutterDieter NiederacherEvgeny ImyamitovOlga M SinilnikovaDominique Stoppa-LyonneSylvie MazoyerCarole Verny-PierreLaurent CasteraAntoine de PauwYves-Jean BignonNancy UhrhammerJean-Philippe PeyratPhilippe VenninSandra Fert FerrerMarie-Agnès Collonge-RameIsabelle MortemousqueGEMO Study CollaboratorsAmanda B SpurdleJonathan BeesleyXiaoqing ChenSue HealeykConFabMary Helen Barcellos-HoffMarc VidalStephen B GruberConxi LázaroGabriel CapelláLesley McGuffogKatherine L NathansonAntonis C AntoniouGeorgia Chenevix-TrenchMarkus C FleischVíctor MorenoMiguel Angel Pujana
Affiliations

Interplay between BRCA1 and RHAMM regulates epithelial apicobasal polarization and may influence risk of breast cancer

Christopher A Maxwell et al. PLoS Biol. 2011 Nov.

Abstract

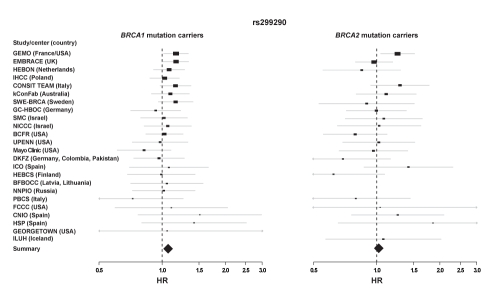
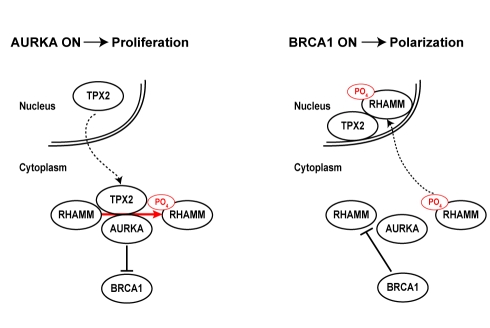
Differentiated mammary epithelium shows apicobasal polarity, and loss of tissue organization is an early hallmark of breast carcinogenesis. In BRCA1 mutation carriers, accumulation of stem and progenitor cells in normal breast tissue and increased risk of developing tumors of basal-like type suggest that BRCA1 regulates stem/progenitor cell proliferation and differentiation. However, the function of BRCA1 in this process and its link to carcinogenesis remain unknown. Here we depict a molecular mechanism involving BRCA1 and RHAMM that regulates apicobasal polarity and, when perturbed, may increase risk of breast cancer. Starting from complementary genetic analyses across families and populations, we identified common genetic variation at the low-penetrance susceptibility HMMR locus (encoding for RHAMM) that modifies breast cancer risk among BRCA1, but probably not BRCA2, mutation carriers: n = 7,584, weighted hazard ratio ((w)HR) = 1.09 (95% CI 1.02-1.16), p(trend) = 0.017; and n = 3,965, (w)HR = 1.04 (95% CI 0.94-1.16), p(trend) = 0.43; respectively. Subsequently, studies of MCF10A apicobasal polarization revealed a central role for BRCA1 and RHAMM, together with AURKA and TPX2, in essential reorganization of microtubules. Mechanistically, reorganization is facilitated by BRCA1 and impaired by AURKA, which is regulated by negative feedback involving RHAMM and TPX2. Taken together, our data provide fundamental insight into apicobasal polarization through BRCA1 function, which may explain the expanded cell subsets and characteristic tumor type accompanying BRCA1 mutation, while also linking this process to sporadic breast cancer through perturbation of HMMR/RHAMM.


Conflict of interest statement

The authors have declared that no competing interests exist.

Figures

Figure 1
Figure 1. Effect of HMMR rs299290 variation on breast cancer risk among BRCA1 and BRCA2 mutation carriers.
Forrest plots show HRs and 95% CIs of the additive model (rs299290 C allele) for all participating centers ordered by sample size (n>30) of BRCA1 mutation carriers (left panel, wHR per study center are shown in Table S2; right panel, effect on BRCA2 mutation carriers). The size of the rectangles is proportional to the corresponding study precision.
Figure 2
Figure 2. Centrosome microtubule assembly is altered as MCF10A are cultured on two- or three-dimensional systems.
(A) Microtubule density (α-tubulin, TUBA) is concentrated around centrosomes (PCNT) within adherent MCF10A. (B) When grown in rBM, microtubule density (TUBA and β-tubulin, TUBB) is initially (top panels, days 1–3 of culture) concentrated around centrosomes (deconvolved z-slices from epifluorescence microscopy images, left panels; confocal microscopy images, right panels; E-cadherin, CDH1; and TUBG1). Upon apical localization of centrosomes (middle panels, days 4–7), microtubule density is amplified at cell-to-cell contacts, as determined by CDH1. This organization is maintained through acinar morphogenesis and lumen formation (bottom panels, after day 10). Scale bars represent 20 µm. (C) Reorganization of VIM intermediate filaments during apicobasal polarization in rBM culture. Confocal images were acquired with equivalent settings to allow comparison of intensities. Scale bars represent 20 µm.
Figure 3
Figure 3. BRCA1 and RHAMM function in epithelial apicobasal polarization.
(A) BRCA1 depletion (shRNA-mediated assay) impairs polarization. Representative bright-field images are shown from control vector pLKO.1 and shRNA-BRCA1 (pLKO.1-based) transduced cultures. Scale bars represent 20 µm. Confocal microscopy images of VIM immunostaining in control and BRCA1-depleted acini are shown. The graph shows results for the area and shape factor measures from four independent experiments. Asterisks indicate significant differences (two-sided t test p<0.05) from controls. (B) Proteasome inhibition (MG132 100 nM) significantly altered acini area and shape factor, and centrosome structure and polarity. Representative bright-field images are shown from DMSO- or MG132-treated cultures. Confocal microscopy images for centrosome structure and polarity (PCNT) in acini following proteasome inhibition, with nuclei counterstained with TOPRO (false color red), are shown. Arrows indicate altered centrosome structures. The graph shows the results of at least three independent experiments. Average centrosome polarity was determined from PCNT signal position within acini relative to nuclei. Across treatments, 33 acini were analyzed, averaging 24.7 centrosomes and nuclei/acini. Circles indicate significant differences (two-sided t test p<0.005) to controls. (C) RHAMM over-expression (pLenti6.2-driven) impairs polarization. Representative bright-field images are shown from control GFP vector or RHAMM (pLenti6.2-) transduced cultures. Middle panel, Western blot analysis for RHAMM over-expression. The graph shows the results of four independent experiments. Values were normalized to untreated cultures within experiments and differences evaluated from GFP controls. (D) TUBG1-GFP over-expression (pLenti6.2-driven) impairs polarization. MCF10A were transduced with GFP or TUBG1-GFP expression constructs, selected with blasticidin and fluorescence-activated cell sorting. Sorted cells were then analyzed for polarization in rBM and the resulting acini examined by bright-field and epifluorescence microscopy. GFP over-expression permitted polarization (left panels). However, acini over-expressing TUBG1-GFP were unable to polarize (representative acini at bottom left in the right panels). Blasticidin-resistant clones with low TUBG1-GFP expression formed normal acini with lumen, as indicated by DAPI (top right acini in the bright-field image). Scale bars represent 20 µm.
Figure 4
Figure 4. Genetic interactions influencing epithelial apicobasal polarization.
(A) shRNA-mediated depletion of centrosome components impairs polarization. Representative bright-field images are shown for results of untreated and control vector pLKO.1, shRNA-AURKA, shRNA-BRCA1, shRNA-HMMR, or shRNA-TPX2 transduced cultures of MCF10A cells in rBM. Magnification is equivalent for all images and scale bars represent 20 µm. (B) Acini architecture was quantified from bright-field images of cultures treated as described above. For comparison between experiments, all values were normalized to untreated cultures within experiments and differences assessed statistically relative to pLKO.1. Shape factor values for single cells, or small clusters, are not plotted. The graph shows the results of at least four independent experiments. For all graphs, asterisks and circles indicate significant differences (two-sided t test p<0.05 and p<0.005, respectively) from controls (pLKO.1). (C) Representative bright-field images of acini from concurrent depletions (shRNA-mediated) as indicated. (D) AURKA-HMMR interact in the regulation of polarization: HMMR depletion rescues the abnormality seen in the shRNA-AURKA assay. Graph shows the results of three independent experiments. (E) Quantification of acini per well confirms the genetic interaction between AURKA and HMMR. Graph shows the results of duplicate experiments. (F) TPX2 depletion is suppressive to abnormalities caused by shRNA-BRCA1 and shRNA-HMMR. Graph shows the results of at least three independent experiments. (G) Prior to the shRNA assays, published data proposed the hypothesis of a signaling pathway from TPX2 to RHAMM regulating polarization; degradation of the microtubule-associated factor RHAMM, through BRCA1, was predicted as key to polarization. However, several observations from the single and concurrent depletion assays (depleted proteins are indicated in grey font) diverged from the expected results (divergent observations are italicized). RHAMM depletion impaired polarization in a manner that was rescued by concurrent depletion of AURKA or TPX2, but not BRCA1. On the other hand, concurrent depletion of BRCA1 and TPX2 revealed normal acini.
Figure 5
Figure 5. pT703-RHAMM functionally connects AURKA with BRCA1 and TPX2.
(A) Molecular diagram of co-immunoprecipitation results (Figure S8) between centrosome module components across the cell cycle, including complexes from pT703-RHAMM IPs (shown in red). (B) Over-expression of GST-AURKA increases pT703-RHAMM. Lysates from HeLa cells, untreated or transfected with GST-AURKA, were immunoblotted for the indicated proteins (GST-AURKA detected by anti-GST). (C) Position T703 of RHAMM is an AURKA substrate in vitro. When normalized to reactions lacking substrate, the combination of recombinant AURKA, ATP, and a T703-containing peptide substrate (acetyl-CKENFALK(T)PLKEGNT-amide) resulted in time-dependent consumption of ATP as measured by luminescence. In contrast, a pre-phosphorylated (PO4) T703-containing peptide (acetyl-CKENFALK(PO4-T)PLKEGNT-amide) showed muted AURKA activity. Asterisk and circles indicate significant differences (two-sided t test p≤0.05 and p<0.005, respectively) relative to control condition (no peptide). (D) AURKA inhibition results in specific loss of pT703-RHAMM. Lysates of HeLa treated with graded concentrations of an AURKA inhibitor (see Materials and Methods) were immunoblotted for the indicated endogenous proteins. (E) pT703-RHAMM cellular immunoreactivity is lost post-metaphase. Consistent with previous reports ,,, total RHAMM decorates all microtubule structures throughout mitosis. In contrast, pT703-RHAMM is lost, or reduced, on microtubule structures after metaphase (arrows). Interphase cells within the field of view indicate specific loss of pT703-RHAMM post-metaphase. The indicated mitotic stage was determined by microtubule organization and DNA condensation (unpublished data). (F) pT703-RHAMM localizes to nuclear compartments. pT703-RHAMM localizes to the nucleus and nuclear envelope. An in-frame post-metaphase cell indicates that nuclear labeling is specific to interphase. Magnification is equivalent for all images and scale bar represents 10 µm.
Figure 6
Figure 6. RHAMM depletion alters TPX2 localization and AURKA activity.
(A) Depletion of RHAMM, but not BRCA1, results in re-localization of TPX2 from the nucleus to the nuclear envelope and cytoplasm (arrows). With RHAMM depletion, microtubule organization is less focused and radial. Scale bar represents 20 µm. (B) RHAMM depletion alters AURKA-TPX2 association. In triplicate experiments, MCF10A were untreated or depleted of BRCA1 or RHAMM, and lysates were immunoprecipitated with AURKA, TPX2, or control IgG antibodies. Compared to untreated or BRCA1-depleted samples, RHAMM depletion resulted in an increase of TPX2 co-precipitated with AURKA. Short and long Western blot exposures are shown. (C) RHAMM depletion alters AURKA activity. Immunoprecipitation beads from triplicate experiments were analyzed for kinase activity using luminescent detection of ATP. Luminescence values were normalized to those obtained for beads precipitated with control IgG. Beads from untreated lysates precipitated with AURKA but not TPX2 antibodies demonstrated modest kinase activity. Depletion of RHAMM led to a significant increase in kinase activity with both AURKA and TPX2 precipitation (asterisks indicate one-sided t test p<0.05). Graph shows means and standard errors from triplicate experiments.
Figure 7
Figure 7. pT703-RHAMM expression in BRCA1 mutant breast cancer cells and tumors.
(A) pT703-RHAMM staining is strong at the nuclear envelope of HCC1937 cells (BRCA1 mutated or transduced with an empty vector; left and middle panels, respectively) but homogeneous nuclear in BRCA1 wild-type reconstituted cells (right panel). (B) Results of pT703-RHAMM staining scores in primary breast tumors with different BRCA1/2 mutation and ER status. Results correspond to scores from two pathologists (see Materials and Methods).
Figure 8
Figure 8. Mechanistic model of interplay between AURKA, BRCA1, RHAMM, and TPX2 that regulates proliferation versus polarization.
Proliferation is proposed to be linked to an active (“on”) status of AURKA while differentiation would be linked to an active BRCA1 status, both centered on tight regulation of RHAMM level and localization.

References

    1. Visvader J. E. Keeping abreast of the mammary epithelial hierarchy and breast tumorigenesis. Genes Dev. 2009;23:2563–2577. - PMC - PubMed
    1. Asselin-Labat M. L, Shackleton M, Stingl J, Vaillant F, Forrest N. C, et al. Steroid hormone receptor status of mouse mammary stem cells. J Natl Cancer Inst. 2006;98:1011–1014. - PubMed
    1. Shackleton M, Vaillant F, Simpson K. J, Stingl J, Smyth G. K, et al. Generation of a functional mammary gland from a single stem cell. Nature. 2006;439:84–88. - PubMed
    1. Sleeman K. E, Kendrick H, Ashworth A, Isacke C. M, Smalley M. J. CD24 staining of mouse mammary gland cells defines luminal epithelial, myoepithelial/basal and non-epithelial cells. Breast Cancer Res. 2006;8:R7. - PMC - PubMed
    1. Sleeman K. E, Kendrick H, Robertson D, Isacke C. M, Ashworth A, et al. Dissociation of estrogen receptor expression and in vivo stem cell activity in the mammary gland. J Cell Biol. 2007;176:19–26. - PMC - PubMed

Publication types

MeSH terms