

Microstructural analysis of human white matter architecture using polarized light imaging: views from neuroanatomy
- PMID: 22110430
- PMCID: PMC3215979
- DOI: 10.3389/fninf.2011.00028
Microstructural analysis of human white matter architecture using polarized light imaging: views from neuroanatomy
Abstract
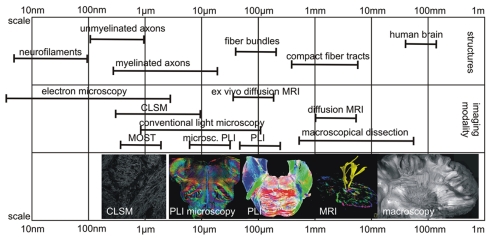
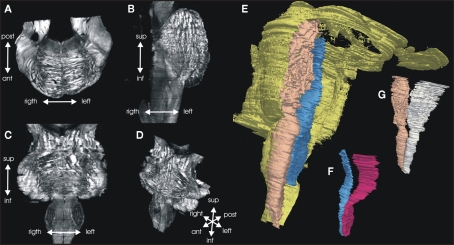
To date, there are several methods for mapping connectivity, ranging from the macroscopic to molecular scales. However, it is difficult to integrate this multiply-scaled data into one concept. Polarized light imaging (PLI) is a method to quantify fiber orientation in gross histological brain sections based on the birefringent properties of the myelin sheaths. The method is capable of imaging fiber orientation of larger-scale architectural patterns with higher detail than diffusion MRI of the human brain. PLI analyses light transmission through a gross histological section of a human brain under rotation of a polarization filter combination. Estimates of the angle of fiber direction and the angle of fiber inclination are automatically calculated at every point of the imaged section. Multiple sections can be assembled into a 3D volume. We describe the principles of PLI and present several studies of fiber anatomy as a synopsis of PLI: six brainstems were serially sectioned, imaged with PLI, and 3D reconstructed. Pyramidal tract and lemniscus medialis were segmented in the PLI datasets. PLI data from the internal capsule was related to results from confocal laser scanning microscopy, which is a method of smaller scale fiber anatomy. PLI fiber architecture of the extreme capsule was compared to macroscopical dissection, which represents a method of larger-scale anatomy. The microstructure of the anterior human cingulum bundle was analyzed in serial sections of six human brains. PLI can generate highly resolved 3D datasets of fiber orientation of the human brain and has high comparability to diffusion MR. To get additional information regarding axon structure and density, PLI can also be combined with classical histological stains. It brings the directional aspects of diffusion MRI into the range of histology and may represent a promising tool to close the gap between larger-scale diffusion orientation and microstructural histological analysis of connectivity.
Keywords: brainstem; cingulum; extreme capsule; internal capsule; polarized light imaging; pyramidal tract.
Figures


Similar articles
-
Polarized light imaging of white matter architecture.Microsc Res Tech. 2007 Oct;70(10):851-63. doi: 10.1002/jemt.20488. Microsc Res Tech. 2007. PMID: 17661367
-
Derivation of Fiber Orientations From Oblique Views Through Human Brain Sections in 3D-Polarized Light Imaging.Front Neuroanat. 2018 Sep 27;12:75. doi: 10.3389/fnana.2018.00075. eCollection 2018. Front Neuroanat. 2018. PMID: 30323745 Free PMC article.
-
High-resolution fiber tract reconstruction in the human brain by means of three-dimensional polarized light imaging.Front Neuroinform. 2011 Dec 30;5:34. doi: 10.3389/fninf.2011.00034. eCollection 2011. Front Neuroinform. 2011. PMID: 22232597 Free PMC article.
-
Decoding the microstructural correlate of diffusion MRI.NMR Biomed. 2019 Apr;32(4):e3779. doi: 10.1002/nbm.3779. Epub 2017 Aug 31. NMR Biomed. 2019. PMID: 28858413 Review.
-
A 3D fiber model of the human brainstem.Comput Med Imaging Graph. 2002 Nov-Dec;26(6):439-44. doi: 10.1016/s0895-6111(02)00036-8. Comput Med Imaging Graph. 2002. PMID: 12453507 Review.
Cited by
-
Mapping Human Brain Pathways: Challenges and Opportunities in the Integration of Scales.Brain Behav Evol. 2023;98(4):194-209. doi: 10.1159/000530317. Epub 2023 Mar 27. Brain Behav Evol. 2023. PMID: 36972574 Free PMC article. Review.
-
Language and visual perception associations: meta-analytic connectivity modeling of Brodmann area 37.Behav Neurol. 2015;2015:565871. doi: 10.1155/2015/565871. Epub 2015 Jan 12. Behav Neurol. 2015. PMID: 25648869 Free PMC article.
-
Broca's area and its striatal and thalamic connections: a diffusion-MRI tractography study.Front Neuroanat. 2013 May 10;7:8. doi: 10.3389/fnana.2013.00008. eCollection 2013. Front Neuroanat. 2013. PMID: 23675324 Free PMC article.
-
Automatic Segmentation of Human Cortical Layer-Complexes and Architectural Areas Using Ex vivo Diffusion MRI and Its Validation.Front Neurosci. 2016 Nov 10;10:487. doi: 10.3389/fnins.2016.00487. eCollection 2016. Front Neurosci. 2016. PMID: 27891069 Free PMC article.
-
Birefringence Changes of Dendrites in Mouse Hippocampal Slices Revealed with Polarizing Microscopy.Biophys J. 2020 May 19;118(10):2366-2384. doi: 10.1016/j.bpj.2020.03.016. Epub 2020 Apr 4. Biophys J. 2020. PMID: 32294480 Free PMC article.
References
-
- Alexander D. C., Seunarine K. K. (2011). “Mathematics of crossing fibers,” in Diffusion MRI: Theory, Methods, and Applications, ed. Jones D. K. (New York: Oxford University Press; ), 451–464
-
- Axer H. (2011). “Invasive methods for tracing white matter architecture,” in Diffusion MRI: Theory, Methods, and Applications, ed. Jones D. K. (New York: Oxford University Press; ), 31–42
LinkOut - more resources
Full Text Sources
Miscellaneous