Functional Anatomy of Non-REM Sleep
- PMID: 22110467
- PMCID: PMC3215999
- DOI: 10.3389/fneur.2011.00070
Functional Anatomy of Non-REM Sleep
Abstract
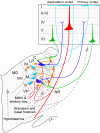
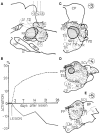
The state of non-REM sleep (NREM), or slow wave sleep, is associated with a synchronized EEG pattern in which sleep spindles and/or K complexes and high-voltage slow wave activity (SWA) can be recorded over the entire cortical surface. In humans, NREM is subdivided into stages 2 and 3-4 (presently named N3) depending on the proportions of each of these polygraphic events. NREM is necessary for normal physical and intellectual performance and behavior. An overview of the brain structures involved in NREM generation shows that the thalamus and the cerebral cortex are absolutely necessary for the most significant bioelectric and behavioral events of NREM to be expressed; other structures like the basal forebrain, anterior hypothalamus, cerebellum, caudal brain stem, spinal cord and peripheral nerves contribute to NREM regulation and modulation. In NREM stage 2, sustained hyperpolarized membrane potential levels resulting from interaction between thalamic reticular and projection neurons gives rise to spindle oscillations in the membrane potential; the initiation and termination of individual spindle sequences depends on corticothalamic activities. Cortical and thalamic mechanisms are also involved in the generation of EEG delta SWA that appears in deep stage 3-4 (N3) NREM; the cortex has classically been considered to be the structure that generates this activity, but delta oscillations can also be generated in thalamocortical neurons. NREM is probably necessary to normalize synapses to a sustainable basal condition that can ensure cellular homeostasis. Sleep homeostasis depends not only on the duration of prior wakefulness but also on its intensity, and sleep need increases when wakefulness is associated with learning. NREM seems to ensure cell homeostasis by reducing the number of synaptic connections to a basic level; based on simple energy demands, cerebral energy economizing during NREM sleep is one of the prevalent hypotheses to explain NREM homeostasis.
Keywords: NREM sleep homeostasis; caudal hypnogenic system; rostral hypnogenic system; sleep need; slow wave sleep; thalamus–cerebral cortex unit.
Figures


Similar articles
-
Enhanced slow-wave activity within NREM sleep in the cortical and subcortical EEG of the cat after sleep deprivation.Sleep. 1992 Apr;15(2):102-18. doi: 10.1093/sleep/15.2.102. Sleep. 1992. PMID: 1579784
-
The time course of sigma activity and slow-wave activity during NREMS in cortical and thalamic EEG of the cat during baseline and after 12 hours of wakefulness.Brain Res. 1992 Nov 20;596(1-2):285-95. doi: 10.1016/0006-8993(92)91559-w. Brain Res. 1992. PMID: 1467989
-
Cerebral correlates of delta waves during non-REM sleep revisited.Neuroimage. 2005 Oct 15;28(1):14-21. doi: 10.1016/j.neuroimage.2005.05.028. Epub 2005 Jun 23. Neuroimage. 2005. PMID: 15979343
-
The visual scoring of sleep and arousal in infants and children.J Clin Sleep Med. 2007 Mar 15;3(2):201-40. J Clin Sleep Med. 2007. PMID: 17557427 Review.
-
Neurophysiology of sleep and wakefulness.Respir Care Clin N Am. 2005 Dec;11(4):567-86. doi: 10.1016/j.rcc.2005.08.001. Respir Care Clin N Am. 2005. PMID: 16303589 Review.
Cited by
-
Subcortical and Cerebellar Neural Correlates of Prodromal Alzheimer's Disease with Prolonged Sleep Latency.J Alzheimers Dis. 2022;86(2):565-578. doi: 10.3233/JAD-215460. J Alzheimers Dis. 2022. PMID: 35068468 Free PMC article.
-
Quercetin-3-O-glucuronide in the Ethanol Extract of Lotus Leaf (Nelumbo nucifera) Enhances Sleep Quantity and Quality in a Rodent Model via a GABAergic Mechanism.Molecules. 2021 May 19;26(10):3023. doi: 10.3390/molecules26103023. Molecules. 2021. PMID: 34069439 Free PMC article.
-
The Transition Between Slow-Wave Sleep and REM Sleep Constitutes an Independent Sleep Stage Organized by Cholinergic Mechanisms in the Rostrodorsal Pontine Tegmentum.Front Neurosci. 2019 Jul 23;13:748. doi: 10.3389/fnins.2019.00748. eCollection 2019. Front Neurosci. 2019. PMID: 31396036 Free PMC article.
-
Assessment of Sleep Spindle Density among Genetically Positive Spinocerebellar Ataxias Types 1, 2, and 3 Patients.Ann Neurosci. 2018 Jul;25(2):106-111. doi: 10.1159/000484516. Epub 2018 Mar 8. Ann Neurosci. 2018. PMID: 30140122 Free PMC article.
-
Cross-Subject EEG-Based Emotion Recognition Through Neural Networks With Stratified Normalization.Front Neurosci. 2021 Feb 3;15:626277. doi: 10.3389/fnins.2021.626277. eCollection 2021. Front Neurosci. 2021. PMID: 33613187 Free PMC article.
References
-
- Alam M. N., McGinty D., Szymusiak R. (1995). Neuronal discharge of preoptic/anterior hypothalamic thermosensitive neurons: relation to NREM sleep. Am. J. Physiol. 269, R1240–R1249 - PubMed
-
- Avendaño C., Stepniewska I., Rausell E., Reinoso-Suárez F. (1990). Segregation and heterogeneity of thalamic cell populations projecting to superficial layers of the posterior parietal cortex: a retrograde tracing study in the cat and monkey. Neuroscience 39, 547–55910.1016/0306-4522(90)90242-V - DOI - PubMed
LinkOut - more resources
Full Text Sources
Medical

