

Bile acid metabolites in serum: intraindividual variation and associations with coronary heart disease, metabolic syndrome and diabetes mellitus
- PMID: 22110577
- PMCID: PMC3215718
- DOI: 10.1371/journal.pone.0025006
Bile acid metabolites in serum: intraindividual variation and associations with coronary heart disease, metabolic syndrome and diabetes mellitus
Abstract
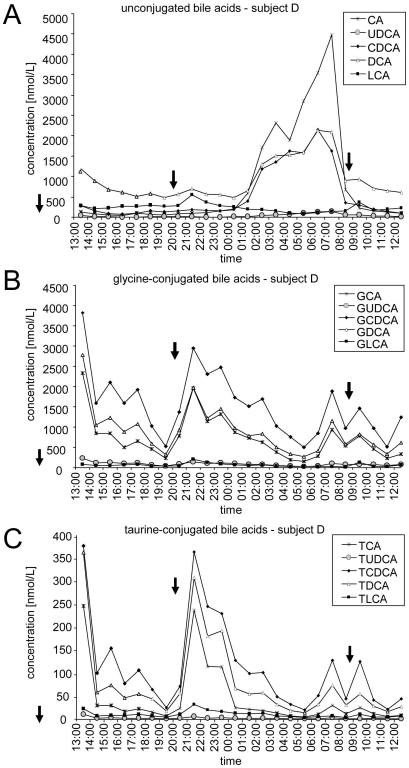
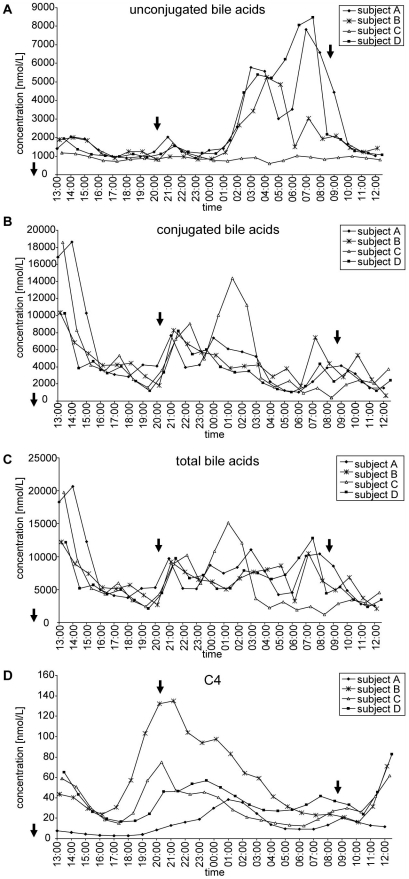
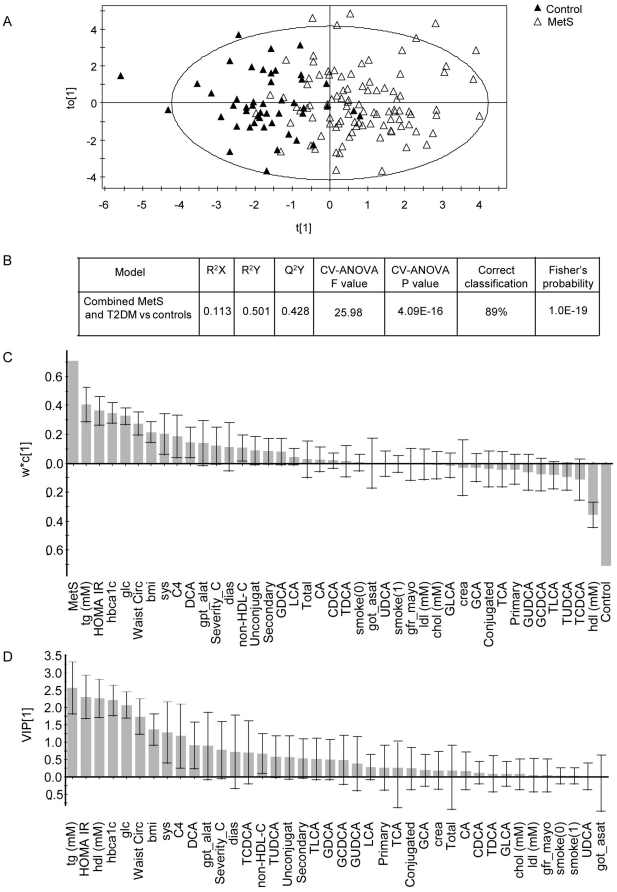
Bile acids (BAs) regulate glucose and lipid metabolism. In longitudinal and case-control-studies, we investigated the diurnal variation of serum concentrations of the 15 major BAs as well as the biosynthetic precursor 7α-hydroxy-4-cholesten-3-one (C4) and their associations, respectively, with coronary artery disease (CAD), diabetes mellitus type 2 (T2DM), and non-diabetic metabolic syndrome (MetS). In hourly taken blood samples of four healthy probands, the intraindividual 24 h variation of C4, conjugated and unconjugated BAs ranged from 42% to 72%, from 23% to 91%, and from 49% to 90%, respectively. Conjugated BA concentrations mainly increased following food intake. Serum levels of C4 and unconjugated BAs changed with daytime with maxima varying interindividually between 20h00 and 1h00 and between 3h00 and 8h00, respectively. Comparisons of data from 75 CAD patients with 75 CAD-free controls revealed no statistically significant association of CAD with BAs or C4. Comparisons of data from 50 controls free of T2DM or MetS, 50 MetS patients, and 50 T2DM patients revealed significantly increased fasting serum levels of C4 in patients with MetS and T2DM. Multiple regression analysis revealed body mass index (BMI) and plasma levels of triglycerides (TG) as independent determinants of C4 levels. Upon multivariate and principle component analyses the association of C4 with T2DM and/or MetS was not independent of or superior to the canonical MetS components. In conclusion, despite large intra- and interindividual variation, serum levels of C4 are significantly increased in patients with MetS and T2DM but confounded with BMI and TG.
Conflict of interest statement
Figures
References
-
- Alberti KG, Zimmet PZ. Definition, diagnosis and classification of diabetes mellitus and its complications. Part 1: diagnosis and classification of diabetes mellitus provisional report of a WHO consultation. Diabet Med. 1998;15:539–553. - PubMed
-
- National Cholesterol Education Program (NCEP) Expert Panel on Detection, Evaluation, and Treatment of High Blood Cholesterol in Adults (Adult Treatment Panel III). Third Report of the National Cholesterol Education Program (NCEP) Expert Panel on Detection, Evaluation, and Treatment of High Blood Cholesterol in Adults (Adult Treatment Panel III) final report. Circulation. 2002;106:3143–3421. - PubMed
-
- Alberti KG, Zimmet P, Shaw J. The metabolic syndrome–a new worldwide definition. Lancet. 2005;366:1059–1062. - PubMed
-
- Alberti KG, Eckel RH, Grundy SM, Zimmet PZ, Cleeman JI, et al. Harmonizing the metabolic syndrome: a joint interim statement of the International Diabetes Federation Task Force on Epidemiology and Prevention; National Heart, Lung, and Blood Institute; American Heart Association; World Heart Federation; International Atherosclerosis Society; and International Association for the Study of Obesity. Circulation. 2009;120:1640–1645. - PubMed
-
- Olefsky JM, Glass CK. Macrophages, inflammation, and insulin resistance. Annu Rev Physiol. 2010;72:219–246. - PubMed
Publication types
MeSH terms
Substances
LinkOut - more resources
Full Text Sources
Medical
Miscellaneous
