. 2011;6(11):e27156.
doi: 10.1371/journal.pone.0027156. Epub 2011 Nov 16.

Optimal deconvolution of transcriptional profiling data using quadratic programming with application to complex clinical blood samples

Affiliations

Optimal deconvolution of transcriptional profiling data using quadratic programming with application to complex clinical blood samples

Ting Gong et al. PLoS One. 2011.

Abstract

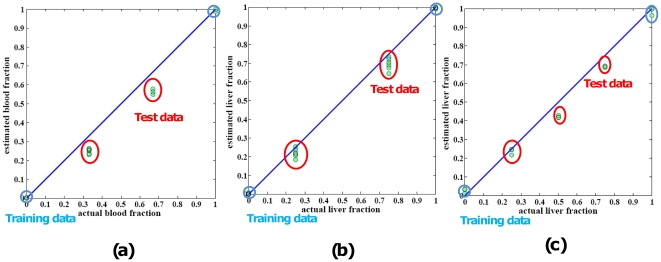
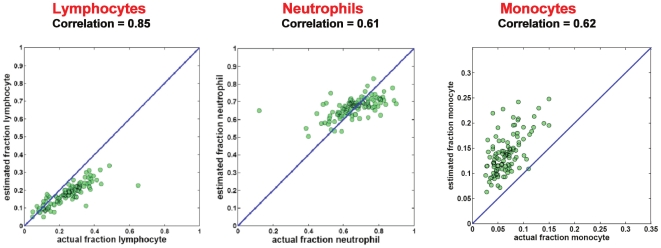
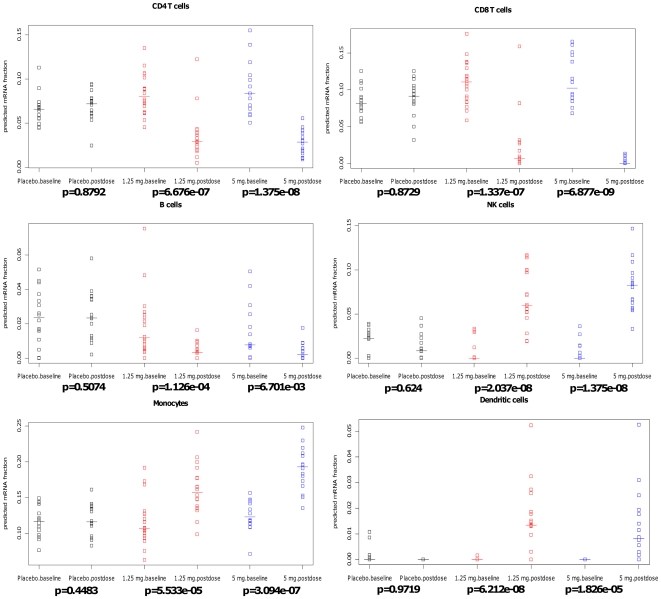
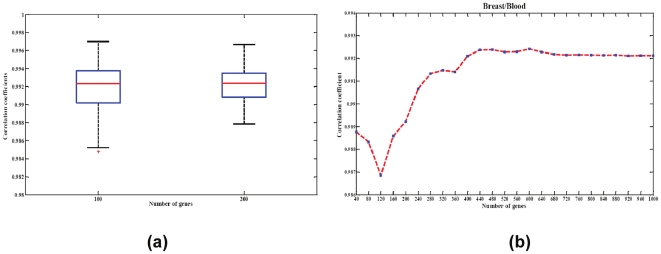
Large-scale molecular profiling technologies have assisted the identification of disease biomarkers and facilitated the basic understanding of cellular processes. However, samples collected from human subjects in clinical trials possess a level of complexity, arising from multiple cell types, that can obfuscate the analysis of data derived from them. Failure to identify, quantify, and incorporate sources of heterogeneity into an analysis can have widespread and detrimental effects on subsequent statistical studies.We describe an approach that builds upon a linear latent variable model, in which expression levels from mixed cell populations are modeled as the weighted average of expression from different cell types. We solve these equations using quadratic programming, which efficiently identifies the globally optimal solution while preserving non-negativity of the fraction of the cells. We applied our method to various existing platforms to estimate proportions of different pure cell or tissue types and gene expression profilings of distinct phenotypes, with a focus on complex samples collected in clinical trials. We tested our methods on several well controlled benchmark data sets with known mixing fractions of pure cell or tissue types and mRNA expression profiling data from samples collected in a clinical trial. Accurate agreement between predicted and actual mixing fractions was observed. In addition, our method was able to predict mixing fractions for more than ten species of circulating cells and to provide accurate estimates for relatively rare cell types (<10% total population). Furthermore, accurate changes in leukocyte trafficking associated with Fingolomid (FTY720) treatment were identified that were consistent with previous results generated by both cell counts and flow cytometry. These data suggest that our method can solve one of the open questions regarding the analysis of complex transcriptional data: namely, how to identify the optimal mixing fractions in a given experiment.


Conflict of interest statement

Competing Interests: TG, NH, VB, FS, ML, SB, JS are employees of Novartis Institutes for BioMedical Research, who funded the study. There are no patents, products in development or marketed products to declare. This does not alter the authors' adherence to all the PLoS ONE policies on sharing data and materials, as detailed online in the guide for authors.

Figures

Figure 1
Figure 1. Statistical deconvolution of complex tissues yields accurate estimates of pure tissue fractions.
Plotting of proportions of cell lines determined from deconvolution (y axis) vs. proportions of the cell lines actually mixed (x axis) shows strong congruity. (a) Proportions of blood cells determined by deconvolution are similar to proportions determined by actual blood fraction. Diagonal lines are y = x, shown for reference, highlighting the agreement between the two methods. The training data in blue circles are from pure reference samples. The test data are from mixed samples with various mixing proportions. (b) Proportions of liver fraction determined by deconvolution are similar to actual liver fraction. (c) Proportions of liver cell lines determined from deconvolution vs. proportions of the cell lines actually mixed are shown a high consistency in rat liver vs. brain dataset.
Figure 2
Figure 2. Comparison of CBC data and statistical deconvolution in whole blood samples.
Determination in whole blood samples of relative abundance of total lymphocytes, neutrophils, or monocytes by CBC compared to determination of relative abundance by deconvolution. Each green dot here corresponds to one sample in the dataset. Diagonal lines are y = x, shown for reference, highlighting the agreement between the two methods.
Figure 3
Figure 3. Estimated fractions for several circulating cell populations.
Strip charts display relating quality of CD4+ cells/CD8+/B cells/NK cells/Monocytes/Dendritic cells. The data are stratified in three different subgroups: placebo (black), low dose: 1.25 mg/day (red) and high dose: 5 mg/day (blue). Data points are from each donor. Y axis is the estimated mRNA fraction. P-values are calculated by Wilcoxon's Signed Rank test.
Figure 4
Figure 4. Robustness of the signature matrix.
(a) Boxplot displaying robustness of chosen signature matrix to gene content. The correlation coefficient distribution (Y axis) is depicted for signatures composed of 100 or 200 randomly selected differentially expressed probesets. (b) Deconvolution performance across a range of signature sizes. The experiment is conducted by increasing the number of cell-type-specific gene probes step-wisely from 40 to 1000.
Figure 5
Figure 5. Stability of the signature matrix.
(a) Boxplot displaying the stability of chosen signature matrix. The chosen signatures are distorted by randomly selecting 5, 10, or 15 percent of its genes and randomly modulating their values with 2 fold changes. The distribution of correlations between actual mixing fractions and fractions estimated using these signatures is depicted. (b) Condition number of the basis matrix with respect to the percentage of simulated differentially expressed genes in the basis matrix.

Similar articles

Cited by

References

    1. Liotta L, Petricoin E. Molecular profiling of human cancer. Nat Rev Genet. 2000;1:48–56. - PubMed
    1. Coleman WB, Tsongalis GJ. 2009. Molecular Pathology: The Molecular Basis of Human Disease: Academic Press; 1 edition (March 16, 2009)
    1. Shen-Orr SS, Tibshirani R, Khatri P, Bodian DL, Staedtler F, et al. Cell type-specific gene expression differences in complex tissues. Nat Methods. 2010;7:287–289. - PMC - PubMed
    1. Lahdesmaki H, Shmulevich l, Dunmire V, Yli-Harja O, Zhang W. In silico microdissection of microarray data from heterogeneous cell populations. BMC Bioinformatics. 2005;6:54. - PMC - PubMed
    1. Wang M, Master S, Chodosh L. Computational expression deconvolution in a complex mammalian organ. BMC Bioinformatics. 2006;7:328. - PMC - PubMed

Publication types