Comparative Study
. 2011;6(11):e27512.
doi: 10.1371/journal.pone.0027512. Epub 2011 Nov 16.

Comparative analyses of pandemic H1N1 and seasonal H1N1, H3N2, and influenza B infections depict distinct clinical pictures in ferrets

Affiliations
Comparative Study

Comparative analyses of pandemic H1N1 and seasonal H1N1, H3N2, and influenza B infections depict distinct clinical pictures in ferrets

Stephen S H Huang et al. PLoS One. 2011.

Abstract

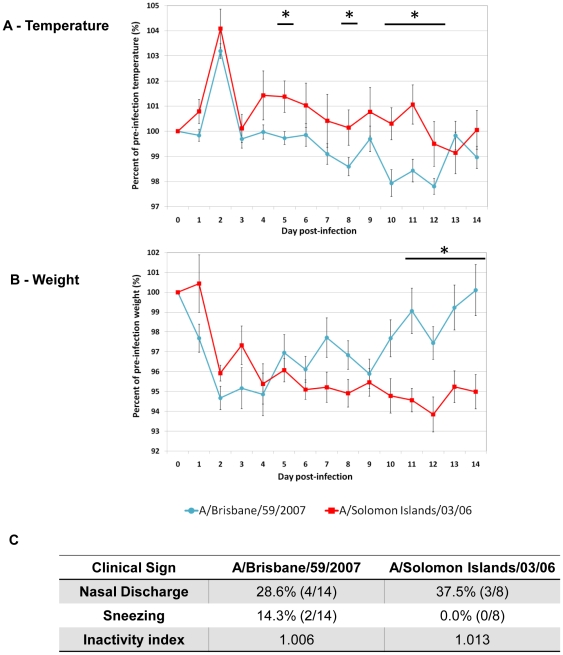
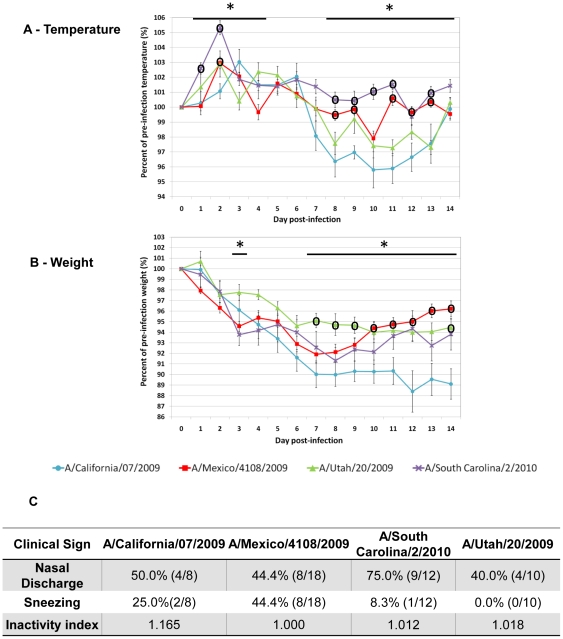
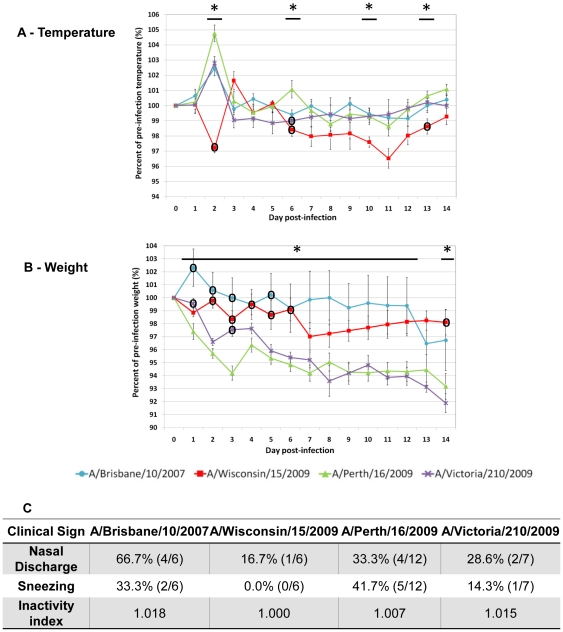
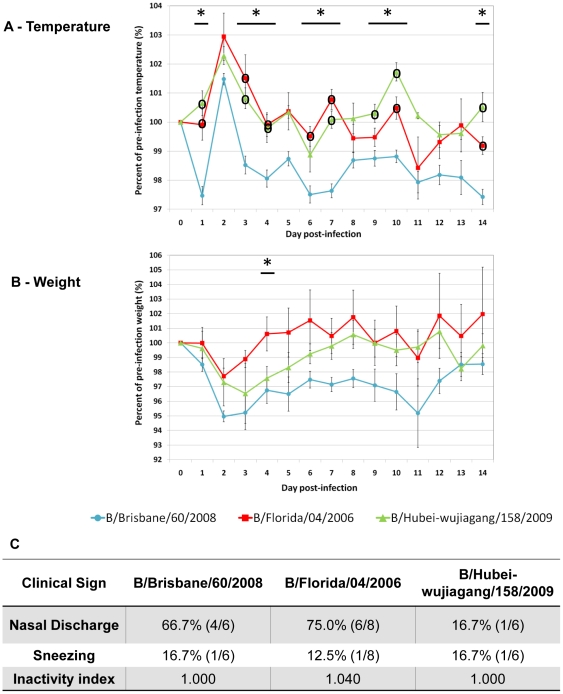
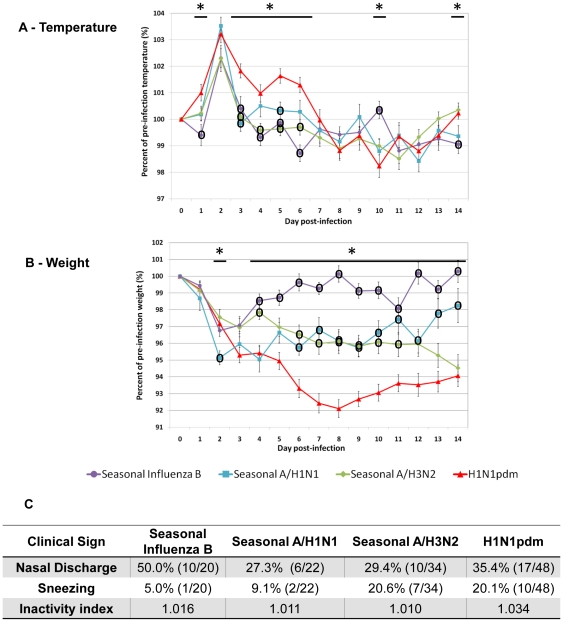
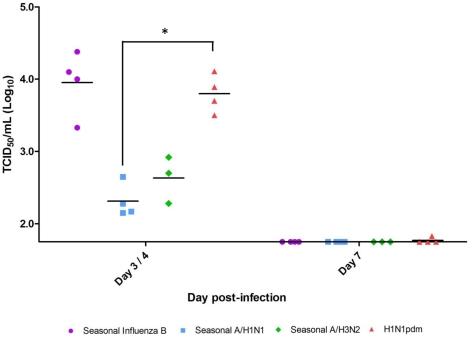
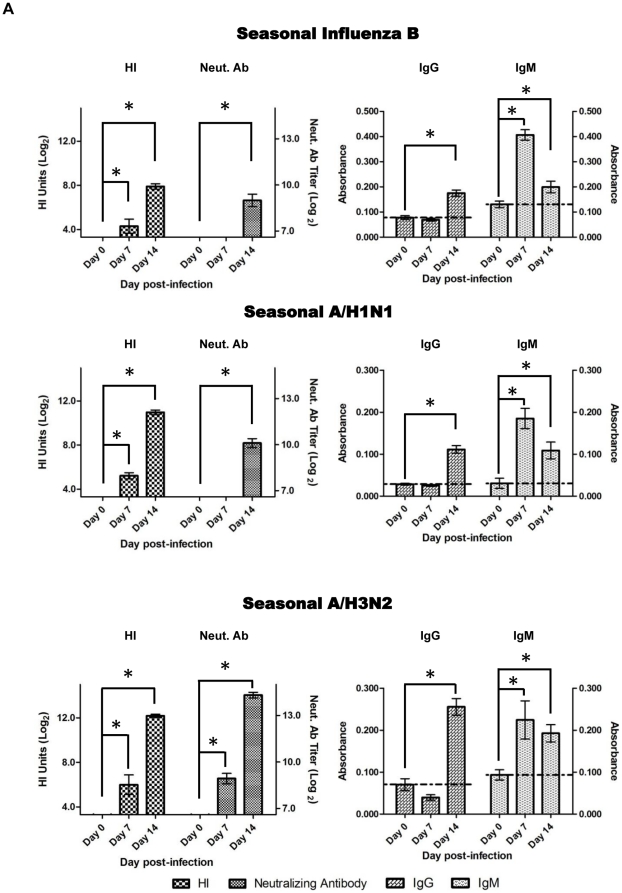
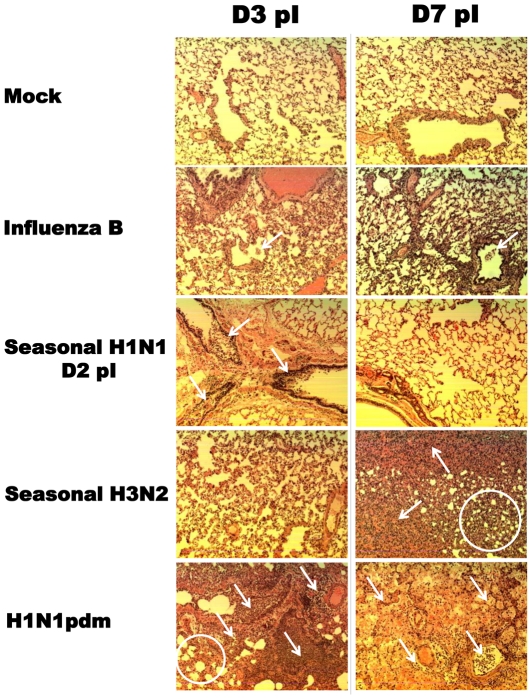
Influenza A and B infections are a worldwide health concern to both humans and animals. High genetic evolution rates of the influenza virus allow the constant emergence of new strains and cause illness variation. Since human influenza infections are often complicated by secondary factors such as age and underlying medical conditions, strain or subtype specific clinical features are difficult to assess. Here we infected ferrets with 13 currently circulating influenza strains (including strains of pandemic 2009 H1N1 [H1N1pdm] and seasonal A/H1N1, A/H3N2, and B viruses). The clinical parameters were measured daily for 14 days in stable environmental conditions to compare clinical characteristics. We found that H1N1pdm strains had a more severe physiological impact than all season strains where pandemic A/California/07/2009 was the most clinically pathogenic pandemic strain. The most serious illness among seasonal A/H1N1 and A/H3N2 groups was caused by A/Solomon Islands/03/2006 and A/Perth/16/2009, respectively. Among the 13 studied strains, B/Hubei-Wujiagang/158/2009 presented the mildest clinical symptoms. We have also discovered that disease severity (by clinical illness and histopathology) correlated with influenza specific antibody response but not viral replication in the upper respiratory tract. H1N1pdm induced the highest and most rapid antibody response followed by seasonal A/H3N2, seasonal A/H1N1 and seasonal influenza B (with B/Hubei-Wujiagang/158/2009 inducing the weakest response). Our study is the first to compare the clinical features of multiple circulating influenza strains in ferrets. These findings will help to characterize the clinical pictures of specific influenza strains as well as give insights into the development and administration of appropriate influenza therapeutics.


Conflict of interest statement

Competing Interests: The authors have declared that no competing interests exist.

Figures

Figure 1
Figure 1. A/Solomon Islands/03/2006 seasonal A/H1N1 subtype showed more severe clinical disease compared to A/Brisbane/59/2007.
Clinical signs of A/Brisbane/59/2007 (N = 14, 106 EID50) or A/Solomon Islands/03/2006 (N = 8, 106 EID50) infected ferrets were measured daily over 14 days. Temperature A) and weight B) were recorded daily until end day and are expressed as percentage relative to the pre-infection level at Day 0. Percent nasal discharge, percent sneezing and inactivity index C) were observed daily and the highest percentages and fractions of infected ferrets displaying symptoms are shown. Physical inactivity index measures the degree to which ferrets respond to environmental stimuli with a basal level of 1.000. Error bars represent standard error of the mean. *p<0.05 from Student's t-test.
Figure 2
Figure 2. A/California/07/2009 infection gave the most severe clinical symptoms of H1N1pdm virus strains.
Clinical signs of ferrets infected with A/Mexico/4108/2009 (N = 18, 105 EID50), A/California/07/2009 (N = 8, 104 EID50), A/South Carolina/2/2010 (N = 12, 105 EID50), or A/Utah/20/2009 (N = 10, 104.3 TCID50) were measured over a 14-day time course. Body temperature A) and weight B) were recorded daily until Day 14 pI. Both measurements are expressed as percentage relative to the pre-infection level at Day 0. C) summarises percent nasal discharge, percent sneezing and inactivity index. These signs were observed daily and the highest percentages and fractions of infected ferrets displaying symptoms are shown. Physical inactivity index measures the degree to which ferrets respond to environmental stimuli with a basal level of 1.000. Error bars represent standard error of the mean. *pAnova<0.05 and °significant difference from A/California/07/2009 by Bonferroni-holm test (post-hoc analysis).
Figure 3
Figure 3. A/Perth/16/2009 infection was more severe than other A/H3N2 seasonal influenza strains.
Ferrets were infected with A/Brisbane/10/2007 (N = 6), A/Wisconsin/15/2009 (N = 6), A/Perth/16/2009 (N = 12), or A/Victoria/210/2009 (N = 10 and N = 7 after Day 8 pI) and clinical signs were measured daily over a 14-day time course. The same dosage (106 EID50) was used for all three infections. Body temperature A) and body weight B) were recorded daily to Day 14 pI. Both measurements are expressed as percentage relative to the pre-infection level at Day 0. Panel C summarises percent nasal discharge, percent sneezing and inactivity index. Percent nasal discharge and percent sneezing were observed daily and the highest percentages and fractions of infected ferrets displaying symptoms are shown. Physical inactivity index measures the degree to which ferrets respond to environmental stimuli with a basal level of 1.000. Error bars represent standard error of the mean. *pAnova<0.05 and °significant difference from A/Perth/16/2009 by Bonferroni-holm test (post-hoc analysis).
Figure 4
Figure 4. Comparison of clinical features among influenza B subtypes showed B/Brisbane/60/2008 infection to give divergent illness.
Clinical signs of ferrets infected with B/Brisbane/60/2008 (N = 6), B/Florida/04/2006 (N = 8), or B/Hubei-Wujiagang/158/2009 (N = 6) were measured daily in a 14-day time course. The same dosage (106 EID50) was used for all three infections. Body temperature A) and body weight B) were recorded daily for 14 days. Both measurements are expressed as percentage relative to the pre-infection level at Day 0. C) summarises qualitative clinical signs: percent nasal discharge and percent sneezing were observed daily and the highest percentages and fractions of infected ferrets displaying symptoms are shown. Physical inactivity index measures the degree to which ferrets respond to environmental stimuli with a basal level of 1.000. Error bars represent standard error of the mean. *pAnova<0.05 and °significant difference from B/Brisbane/60/2008 by Bonferroni-holm test (post-hoc analysis).
Figure 5
Figure 5. Influenza A/H1N1, A/H3N2, and B infections in ferrets gives distinct clinical trends.
Ferret clinical data from H1N1pdm (N = 48), seasonal A/H1N1 (N = 22), seasonal A/H3N2 (N = 34 and N = 31 after Day 8 pI), and seasonal influenza B (N = 20) infections were combined respectively for inter-group comparison. The combined body temperature A) and body weight B) are expressed as percentage relative to the pre-infection level at Day 0. Percent nasal discharge, percent sneezing, and physical inactivity index are recalculated for each group and summarized in C). Amount of animals displaying nasal discharge and sneezing from each group were combined and calculated as percentage for each day. Only the highest percentages and fractions from each group are shown. Physical inactivity index is the pooled measure of which infected ferrets by each group respond to environmental stimuli with a basal level of 1.000. Error bars stand for standard error of the mean. *pAnova<0.05 and °significant difference from H1N1pdm by Bonferroni-holm test (post-hoc analysis).
Figure 6
Figure 6. Influenza viral replication in the upper respiratory tract of ferrets following intranasal infection.
One most recent circulating representative strain for each subtype was chosen as follows: Mex/4108 for H1N1pdm, Bris/59 for seasonal A/H1N1, Vic/210 for seasonal A/H3N2, and B/Hubei for seasonal influenza B. All nasal wash samples from infected ferrets were collected on Day 3 and Day 7 pI except for Vic/210 infection (Day 4 and Day 7 pI) and titrated on MDCK cells (TCID50/mL). Statistical analysis was only conducted on samples collected on the same day pI. *pAnova<0.005 and significant difference was found between H1N1pdm with seasonal H1N1 by Bonferroni-holm test (post-hoc analysis).
Figure 7
Figure 7. Influenza induced antibody responses mirror specific influenza strain illness.
A) Time course of influenza induced antibody responses for various subtypes. Ferret anti-sera taken at the indicated days pI were used to measure HI, neutralizing antibodies and relative IgG or IgM levels. Student's t-test was conducted to compare with results on Day 0, *p<0.05. B) Day 14 pI HI titers from individual animals infected by corresponding influenza strains. HIs of A/Mexico/4108/2009 infected animal sera was used to compare with HIs of other strains using Student's t-test. *p<0.005, **p<0.000005.
Figure 8
Figure 8. Histopathology of influenza subtype infected lung tissues by H&E stain.
The representative strain for each subtype was selected as follows: Mex/4108 for H1N1pdm, Bris/59 for seasonal H1N1, Per/16 for seasonal H3N2, and B/Wis (same influenza B lineage as B/Hubei) for seasonal influenza B. All tissue samples from infected ferrets were collected on Day 3 and Day 7 pI except for Bris/59 infection (Day 2 and Day 7 pI due to facility scheduling). Representative slides are shown with 10× magnification.

Similar articles

Cited by

References

    1. Munster VJ, Fouchier RA. Avian influenza virus: of virus and bird ecology. Vaccine. 2009;27:6340–6344. - PubMed
    1. Sym D, Patel PN, El Chaar GM. Seasonal, avian, and novel H1N1 influenza: prevention and treatment modalities. Ann Pharmacother. 2009;43:2001–2011. - PubMed
    1. Girard MP, Tam JS, Assossou OM, Kieny MP. The 2009 A (H1N1) influenza virus pandemic: A review. Vaccine. 2010;28:4895–4902. - PubMed
    1. Khanna M, Kumar P, Choudhary K, Kumar B, Vijayan VK. Emerging influenza virus: a global threat. J Biosci. 2008;33:475–482. - PMC - PubMed
    1. Rajagopal S, Treanor J. Pandemic (avian) influenza. Semin Respir Crit Care Med. 2007;28:159–170. - PubMed

Publication types

MeSH terms

Substances