. 2011;6(11):e27580.
doi: 10.1371/journal.pone.0027580. Epub 2011 Nov 16.

Dynamic modulation of thymic microRNAs in response to stress

Affiliations

Dynamic modulation of thymic microRNAs in response to stress

Serkan Belkaya et al. PLoS One. 2011.

Abstract

Physiological stress evokes rapid changes in both the innate and adaptive immune response. Immature αβ T cells developing in the thymus are particularly sensitive to stress, with infections and/or exposure to lipopolysaccharide or glucocorticoids eliciting a rapid apoptotic program. MicroRNAs are a class of small, non-coding RNAs that regulate global gene expression by targeting diverse mRNAs for degradation. We hypothesized that a subset of thymically encoded microRNAs would be stress responsive and modulate thymopoiesis. We performed microRNA profiling of thymic microRNAs isolated from control or stressed thymic tissue obtained from mice. We identified 18 microRNAs that are dysregulated >1.5-fold in response to lipopolysaccharide or the synthetic corticosteroid dexamethasone. These included the miR-17-90 cluster, which have anti-apoptotic functions, and the miR-181 family, which contribute to T cell tolerance. The stress-induced changes in the thymic microRNAs are dynamically and distinctly regulated in the CD4(-)CD8(-), CD4(+)CD8(+), CD4(+)CD8(-), and CD4(-)CD8(+) thymocyte subsets. Several of the differentially regulated murine thymic miRs are also stress responsive in the heart, kidney, liver, brain, and/or spleen. The most dramatic thymic microRNA down modulated is miR-181d, exhibiting a 15-fold reduction following stress. This miR has both similar and distinct gene targets as miR-181a, another member of miR-181 family. Many of the differentially regulated microRNAs have known functions in thymopoiesis, indicating that their dysregulation will alter T cell repertoire selection and the formation of naïve T cells. This data has implications for clinical treatments involving anti-inflammatory steroids, ablation therapies, and provides mechanistic insights into the consequences of infections.


Conflict of interest statement

Competing Interests: The authors have declared that no competing interests exist.

Figures

Figure 1
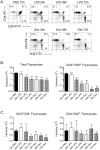
Figure 1. Lipopolysaccharide and dexamethasone deplete immature CD4+CD8+ thymocytes.
A) Thymocytes were isolated from either control (PBS injected, t = 72 h), or LPS and dexamethasone (Dex) injected mice (t = 24, 48 and 72 h). The cells were stained with fluorochrome-labeled anti-CD4 and anti-CD8 mAbs and analyzed by flow cytometry. The percentage of CD4CD8 (DN), CD4+CD8+ (DP), CD4+CD8 (CD4 SP), and CD4CD8+ (CD8 SP) subsets are provided in each quadrant of the dot plot profiles. B) The total thymic cellularity and the number of CD4+CD8+ cells were calculated at 24, 48, and 72 h post-injection and are shown in a log scale. C) The absolute number of mature CD4+CD8 and CD4CD8+ SP cells after PBS, LPS, and Dex treatments were calculated at t = 24, 48 and 72 h post-injection. Data are representative of mean +/− SD from at least 8 mice per group (*p<0.05, **p<0.01, *** p<0.001, versus PBS control; one-way ANOVA analyses).
Figure 2
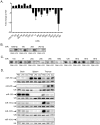
Figure 2. Stress responsive signature microRNAs in thymic tissue.
A) Graph shows 18 distinct miRs with a statistically significant fold change (p<0.05) in expression. Fold change indicates the change in miR expression in LPS-treated sample relative to PBS-treated sample. B) Northern blots of 4 miRs that were up regulated in thymic tissue 72 h after LPS injections. C) Northern blots were performed on 10 miRs that were down-regulated 72 h after LPS exposure. D) Differential expression of stress responsive miRs in diverse tissues. Male mice were injected with PBS, LPS or Dex. Total RNA was isolated from the brain, spleen, and thymus of control (PBS) and LPS- or Dex- treated mice at 72 h post-injection. The individual miRs (miR-150, miR-205, miR-128, miR-181a, miR-181b, miR-181d) were detected by Northern blotting. The relative amounts of a control RNA were determined by blotting for U6.
Figure 3
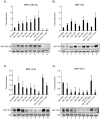
Figure 3. Stress responsive changes in thymic miR profiles are time dependent.
Total RNA was isolated from thymic tissue prepared from PBS- (lane 1), LPS- (lanes 2–4), and Dex- (lanes 5–7) treated mice at 24 h (lanes 2, 5), 48 h (lanes 3, 6), and 72 h (lanes 1, 4, 7). In lanes 8–9, RNA was prepared from purified T cells isolated from the thymus. Northern blots were performed for the selected miRs A) Mir-125, B) MiR-150, C) MiR-181a, and D) MiR-181d. The samples were quantified by phoshorimager analyses, following background subtraction, and normalizing for total RNA amounts with a U6 probe. Data shown are mean +/− SD of relative fold changes in miR expression levels of PBS- versus LPS- or Dex-treated samples from 3 to 5 independent Northern blots (*p<0.05, **p<0.01, *** p<0.001, versus PBS control; unpaired Student t-test).
Figure 4
Figure 4. Stress responsive thymic miRs are differentially regulated in thymocyte subsets.
Thymocytes from PBS and LPS injected mice (72 h) were sorted into A) CD4CD8 (DN), B) CD4+CD8+ (DP), C) CD4+CD8 (CD4 SP), and D) CD4CD8+ (CD8 SP) subsets using high speed cell sorting. RNA was isolated from the sorted subpopulations. Real-time microRNA RT-PCR was used to detect the levels of the indicated miRs in various subsets. The vertical line on the figure indicates the control (PBS) threshold set at 1. Data represent the averaged fold changes in miR expression levels of PBS- versus LPS-treated samples calculated by ΔΔCT normalized to the endogenous U6 levels, of 4 independent experiments performed in triplicate (*p<0.05, **p<0.01, *** p<0.001, versus the threshold; one sample Student t-test).
Figure 5
Figure 5. Target specificity of miR-181 family members.
A) Homology of miR-181 family members with the seed sequences shaded. B) Schematic representation of the reporter constructs and predicted binding sites of miR-181 family in the 3′ untranslated region of Cd69, prox1, and Lif. C–D) Luciferase reporter assays. A beta-galactosidase expressing vector, and luciferase reporter constructs containing the 3′ untranslated region of the murine Cd69, Prox1, and Lif (WT or with point mutations in two putative miR-181 binding sites (Mut. Lif) genes were co-transfected along with vector alone or vectors expressing mir-181a or miR-181d. Firefly luciferase activity was normalized to beta-galactosidase activity. Each graph represents mean +/− SD of the ratio of the normalized luciferase activity in miR-181 and control vector transfections from three independent experiments, with each sample tested in triplicate (n.s. = not significant, *p<0.05, **p<0.01, *** p<0.001, versus vector alone, unpaired Student t-test).

References

    1. Starr TK, Jameson SC, Hogquist KA. Positive and negative selection of T cells. Annu Rev Immunol. 2003;21:139–176. - PubMed
    1. Douek DC, McFarland RD, Keiser PH, Gage EA, Massey JM, et al. Changes in thymic function with age and during the treatment of HIV infection. Nature. 1998;396:690–695. - PubMed
    1. Murgita RA, Wigzell H. Regulation of immune functions in the fetus and newborn. Prog Allergy. 1981;29:54–133. - PubMed
    1. Winoto A, Littman DR. Nuclear hormone receptors in T lymphocytes. Cell. 2002;109(Suppl):S57–66. - PubMed
    1. Gruver AL, Sempowski GD. Cytokines, leptin, and stress-induced thymic atrophy. Journal of leukocyte biology. 2008;84:915–923. - PMC - PubMed

Publication types

MeSH terms