. 2011;6(11):e27628.
doi: 10.1371/journal.pone.0027628. Epub 2011 Nov 14.

Differential proliferation rhythm of neural progenitor and oligodendrocyte precursor cells in the young adult hippocampus

Affiliations

Differential proliferation rhythm of neural progenitor and oligodendrocyte precursor cells in the young adult hippocampus

Yoko Matsumoto et al. PLoS One. 2011.

Abstract

Oligodendrocyte precursor cells (OPCs) are a unique type of glial cells that function as oligodendrocyte progenitors while constantly proliferating in the normal condition from rodents to humans. However, the functional roles they play in the adult brain are largely unknown. In this study, we focus on the manner of OPC proliferation in the hippocampus of the young adult mice. Here we report that there are oscillatory dynamics in OPC proliferation that differ from neurogenesis in the subgranular zone (SGZ); the former showed S-phase and M-phase peaks in the resting and active periods, respectively, while the latter only exhibited M-phase peak in the active period. There is coincidence between different modes of proliferation and expression of cyclin proteins that are crucial for cell cycle; cyclin D1 is expressed in OPCs, while cyclin D2 is observed in neural stem cells. Similar to neurogenesis, the proliferation of hippocampal OPCs was enhanced by voluntary exercise that leads to an increase in neuronal activity in the hippocampus. These data suggest an intriguing control of OPC proliferation in the hippocampus.


Conflict of interest statement

Competing Interests: The authors have declared that no competing interests exist.

Figures

Figure 1
Figure 1. Analyses of cell-type specific markers in BrdU-positive cells in the hippocampal neurogenic area and non-neurogenic area.
(A, B) Immunostaining with anti-BrdU, anti-nestin (A), and anti-DCX (B) antibodies in the neurogenic area. White arrows indicate BrdU-positive cells labeled with neural stem/progenitor cell markers. (C to E) Double immunostaining with anti-BrdU and anti-Olig2 (C), anti-PDGFRα (D), or anti-NG2 (E) antibodies in the non-neurogenic area. White arrows indicate BrdU-positive cells labeled with each OPC marker (C to E). Note that the dividing OPCs extend processes. (F to I) Double immunostaining with anti-BrdU and anti-GFAP (F), anti-Iba1 (G), anti-nestin (H) and anti-DCX (I) antibodies in the non-neurogenic area. White arrowheads indicate BrdU-positive cells that are negative for GFAP (F), Iba1 (G), nestin (H), and DCX (I). Yellow arrows indicate Iba1-positive cells (G). (J) The percentage of cells positive for each marker among all BrdU-positive cells. Scale bars: 20 µm (A to I).
Figure 2
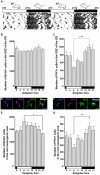
Figure 2. Daily variation in the number of BrdU-positive cells and PH3-positive cells in the neurogenic area and the non-neurogenic area of the hippocampus.
(A) Representative actogram of the locomotor activity of a mouse reared under a constant L-D cycle. The white and black horizontal bars represent the light and dark periods, respectively, across two days. Black bars on each line represent the amount of locomotor activity. (B) Total number of BrdU-positive cells in the neurogenic area at various ZT (mean ± s.e.m., n = 8 to 10 for each time point). White and black bars represent light and dark periods of the day, respectively. There was no significant variation in the number of BrdU-positive cells between each time point ZT (p = 0.322 by one-way ANOVA). (C) Total number of PH3-positive cells in the neurogenic area at various ZT. The number of PH3-positive cells was the highest at ZT18 and the lowest at ZT6 (mean ± s.e.m., n = 8 for each time point, p<0.001 by one-way ANOVA, ***p<0.001 and by a post hoc Tukey test). (D) BrdU-positive cells labeled with NG2 in the non-neurogenic area. (E) Total number of BrdU-positive cells in the non-neurogenic area at various ZT (mean ± s.e.m., n = 8 to 10 for each time point). The number of BrdU-positive cells was the highest at ZT6 and the lowest at ZT21 (p = 0.021 by one-way ANOVA, *p<0.05 by a post hoc Tukey test). (F) PH3-positive cell labeled with NG2 in the non-neurogenic area. (G) Total number of PH3-positive cells in the non-neurogenic areas at various ZT. The number of PH3-positive cells was the highest at ZT18 and the lowest at ZT6 (mean ± s.e.m., n = 8 for each time point, p = 0.004 by one-way ANOVA, **p<0.01 by a post hoc Tukey test).
Figure 3
Figure 3. Cyclin D1 is expressed in OPCs in the hippocampus.
(A) Immunostaining with anti-cyclin D2 antibody in the hippocamous. Immunoreactive signals were seen along the SGZ of the DG. (B) Immunostaining with anti-cyclin D1 antibody in the hippocampus. White dots show the margin of the DG. The bright band of immunoreactivity seen above the DG is the cluster of pyramidal neurons in CA1 as previously reported . (C and D) Double immunostaining with anti-PDGFRα and anti-cyclin D1 antibodies in the hippocampus. White arrows indicate PDGFRα-positive cells that are positive for cyclin D1. Higher magnitude image of double positive cell (D). Scale bar: 20 µm. (E) The percentage of cells positive for each marker among all PDGFRα-positive cells.

References

    1. Imayoshi I, Sakamoto M, Ohtsuka T, Takao K, Miyakawa T, et al. Roles of continuous neurogenesis in the structural and functional integrity of the adult forebrain. Nat Neurosci. 2008;11:1153–1161. - PubMed
    1. Ming GL, Song H. Adult neurogenesis in the mammalian central nervous system. Annu Rev Neurosci. 2005;28:223–250. - PubMed
    1. Dawson MR, Polito A, Levine JM, Reynolds R. NG2-expressing glial progenitor cells: an abundant and widespread population of cycling cells in the adult rat CNS. Mol Cell Neurosci. 2003;24:476–488. - PubMed
    1. Gensert JM, Goldman JE. Heterogeneity of cycling glial progenitors in the adult mammalian cortex and white matter. J Neurobiol. 2001;48:75–86. - PubMed
    1. Levine JM, Stincone F, Lee YS. Development and differentiation of glial precursor cells in the rat cerebellum. Glia. 1993;7:307–321. - PubMed

Publication types