

Real-time decoding of brain responses to visuospatial attention using 7T fMRI
- PMID: 22110702
- PMCID: PMC3215723
- DOI: 10.1371/journal.pone.0027638
Real-time decoding of brain responses to visuospatial attention using 7T fMRI
Abstract
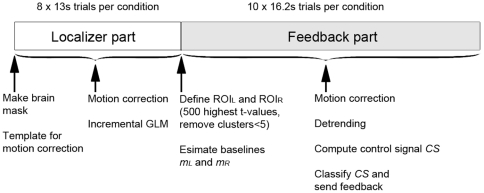
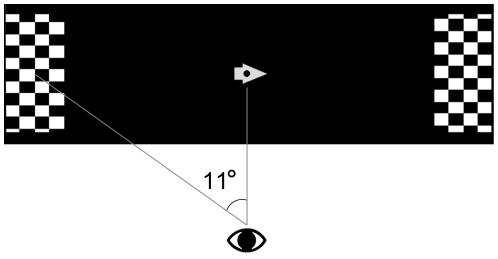
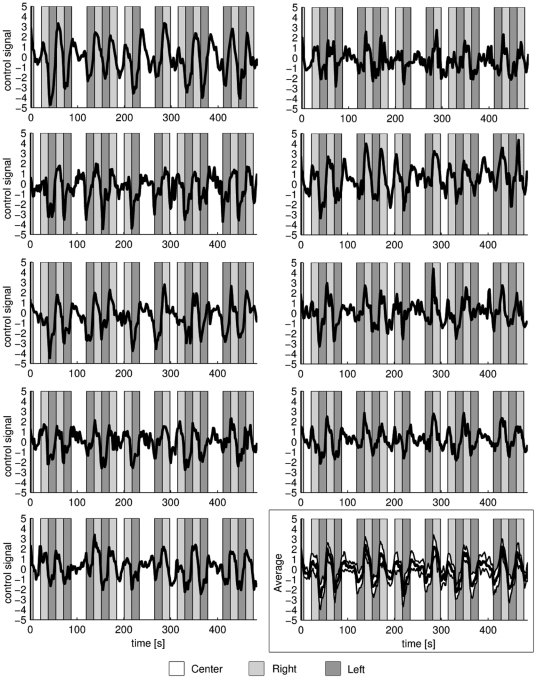
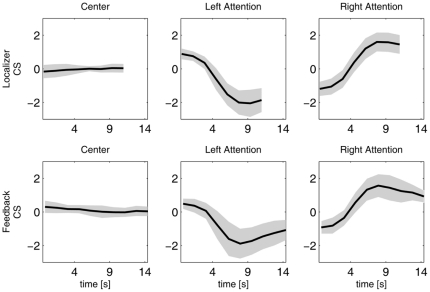
Brain-Computer interface technologies mean to create new communication channels between our mind and our environment, independent of the motor system, by detecting and classifying self regulation of local brain activity. BCIs can provide patients with severe paralysis a means to communicate and to live more independent lives. There has been a growing interest in using invasive recordings for BCI to improve the signal quality. This also potentially gives access to new control strategies previously inaccessible by non-invasive methods. However, before surgery, the best implantation site needs to be determined. The blood-oxygen-level dependent signal changes measured with fMRI have been shown to agree well spatially with those found with invasive electrodes, and are the best option for pre-surgical localization. We show, using real-time fMRI at 7T, that eye movement-independent visuospatial attention can be used as a reliable control strategy for BCIs. At this field strength even subtle signal changes can be detected in single trials thanks to the high contrast-to-noise ratio. A group of healthy subjects were instructed to move their attention between three (two peripheral and one central) spatial target regions while keeping their gaze fixated at the center. The activated regions were first located and thereafter the subjects were given real-time feedback based on the activity in these regions. All subjects managed to regulate local brain areas without training, which suggests that visuospatial attention is a promising new target for intracranial BCI. ECoG data recorded from one epilepsy patient showed that local changes in gamma-power can be used to separate the three classes.
Conflict of interest statement
Figures


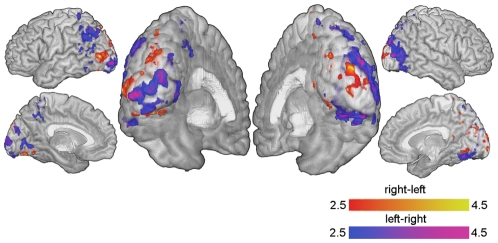
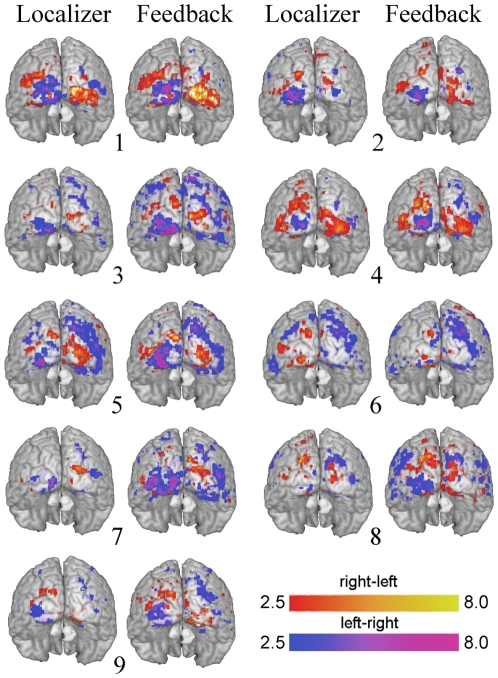
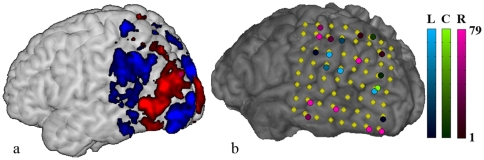
 , red: ’right-left’, blue: ’left-right’). (b) The yellow markers show the electrodes' locations on the cortical surface. On top of the markers it is shown in how many of the leave-one-out tests the electrode was included. Red, blue and green represent right, left and center attention.
References
-
- Wolpaw JR, Birbaumer N, McFarland DJ, Pfurtscheller G, Vaughan TM. Brain-computer interfaces for communication and control. Clin Neurophysiol. 2002;113:767–791. - PubMed
-
- Serruya MD, Hatsopoulos NG, Paninski L, Fellows MR, Donoghue JP. Brain-machine interface: Instant neural control of a movement signal. Nature. 2002;416:141–142. - PubMed
-
- Taylor DM, Tillery SIH, Schwartz AB. Direct cortical control of 3D neuroprosthetic devices. Science. 2002;296:1829–1832. - PubMed
Publication types
MeSH terms
LinkOut - more resources
Full Text Sources
Medical
