

Real-time quantitative polymerase chain reaction for enumeration of Streptococcus mutans from oral samples
- PMID: 22112030
- PMCID: PMC3517291
- DOI: 10.1111/j.1600-0722.2011.00888.x
Real-time quantitative polymerase chain reaction for enumeration of Streptococcus mutans from oral samples
Abstract
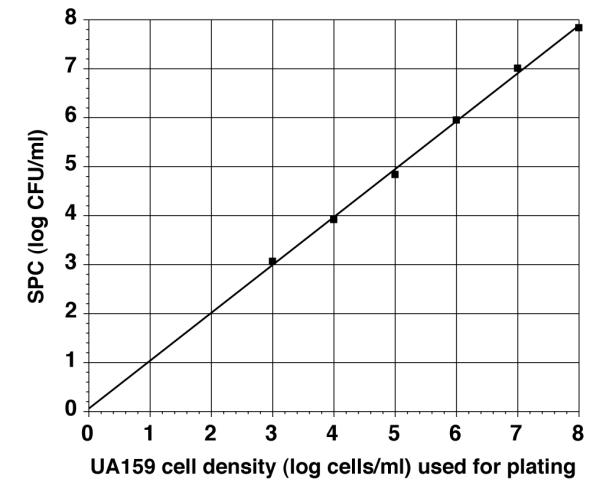
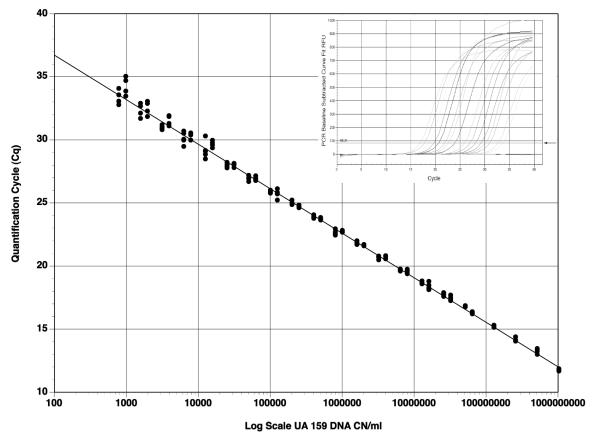
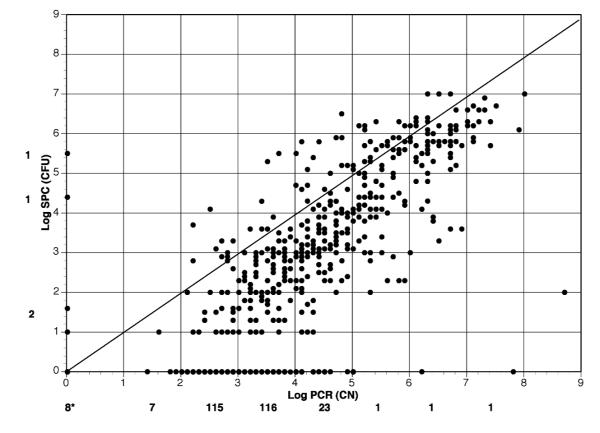
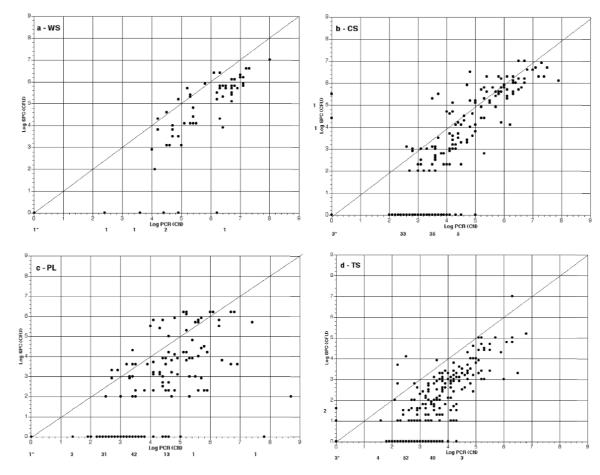
This study compared SYBR Green real-time quantitative PCR (qPCR) with standard plate counting for the enumeration of Streptococcus mutans in oral samples. Oral samples (n = 710) were collected from high-caries-risk children for quantification of S. mutans by qPCR using primer pairs. The S. mutans copy number was calculated with reference to a qPCR quantification cycle (Cq) standard curve and compared with the absorbance value at 600 nm of a standard suspension of S. mutans UA159. The S. mutans copy number results were evaluated in relation to standard plate count (SPC) results obtained from each sample following culture on Petri plates containing S. mutans selective media and reported as colony-forming units (CFUs). The mean S. mutans copy number calculated from qPCR was higher than the SPC CFUs (1.3 × 10(6) and 1.5 × 10(5) CFUs, respectively). The qPCR values were usually higher in individual samples and qPCR detected the presence of S. mutans 84% (231/276) of the time that the SPC did not, compared with 33% (4/12) of the time when qPCR failed to detect S. mutans and the SPC did. The qPCR technique was found to be more sensitive for detection of S. mutans from oral samples, a method that is not dependent on the viability of the sample taken and therefore is proposed as a more reliable and efficient means of quantification of S. mutans.
© 2011 Eur J Oral Sci.
Figures
References
-
- Zero DT. Dental caries process. Dent Clin North Am. 1999;43:635–664. - PubMed
-
- Bloomquist CG, Liljemark WF. Dental plaque. In: Nataro JP, Blaser MJ, editors. Persistent Bacterial Infections. ASM Press; Washington, D.C.: 2000. pp. 409–422.
-
- Russell RB. The molecular biology of cariogenic bacteria. In: Rogers AH, editor. Molecular Oral Microbiology. Caister Academic Press; Norfolk, UK: 2008. pp. 109–134.
-
- Tanzer JM, Livingston J, Thompson AM. The microbiology of primary dental caries in humans. J Dent Educ. 2001;65:1028–1037. - PubMed
-
- van Der Hoeven JS, van Palenstein Helderman W. Microbial specificity and dental caries. In: Guggenheim B, Shapiro S, editors. Proceedings of the Conference: Oral Biology at the Turn of the Century Misconceptions, Truths, Challenges and Prospects. Karger; Basel: 1998. pp. 43–55.
Publication types
MeSH terms
Grants and funding
LinkOut - more resources
Full Text Sources
Medical
