

Hyperspectral molecular imaging of multiple receptors using immunolabeled plasmonic nanoparticles
- PMID: 22112108
- PMCID: PMC3273308
- DOI: 10.1117/1.3646529
Hyperspectral molecular imaging of multiple receptors using immunolabeled plasmonic nanoparticles
Abstract
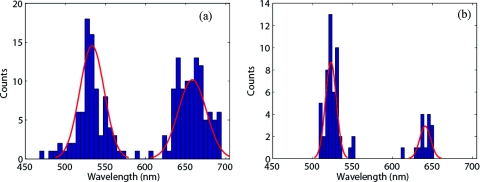
This work presents simultaneous imaging and detection of three different cell receptors using three types of plasmonic nanoparticles (NPs). The size, shape, and composition-dependent scattering profiles of these NPs allow for a system of multiple distinct molecular markers using a single optical source. With this goal in mind, tags consisting of anti-epidermal growth factor receptor gold nanorods, anti-insulin-like growth factor 1-R silver nanospheres, and human epidermal growth factor receptor 2Ab gold nanospheres were developed to monitor the expression of receptors commonly overexpressed by cancer cells. These labels were chosen because they scatter strongly in distinct spectral windows. A hyperspectral darkfield microspectroscopy system was developed to record the scattering spectra of cells labeled with these molecular tags. Simultaneous monitoring of multiple tags may lead to applications such as profiling of cell line immunophenotype and investigation of receptor signaling pathways. Single, dual, and triple tag experiments were performed to analyze NP tag specificity as well as their interactions. Distinct resonance peaks were observed in these studies, showing the ability to characterize cell lines using conjugated NPs. However, interpreting shifts in these peaks due to changes in a cellular dielectric environment may be complicated by plasmon coupling between NPs bound to proximal receptors and other coupling mechanisms due to the receptors themselves.
Figures


Similar articles
-
Optimization of immunolabeled plasmonic nanoparticles for cell surface receptor analysis.Methods. 2012 Feb;56(2):310-6. doi: 10.1016/j.ymeth.2011.08.017. Epub 2011 Sep 1. Methods. 2012. PMID: 21911063 Free PMC article. Review.
-
Molecular imaging of epidermal growth factor receptor in live cells with refractive index sensitivity using dark-field microspectroscopy and immunotargeted nanoparticles.J Biomed Opt. 2008 Jan-Feb;13(1):014022. doi: 10.1117/1.2837450. J Biomed Opt. 2008. PMID: 18315380
-
Dynamic imaging of molecular assemblies in live cells based on nanoparticle plasmon resonance coupling.Nano Lett. 2009 Oct;9(10):3612-8. doi: 10.1021/nl9018275. Nano Lett. 2009. PMID: 19645464 Free PMC article.
-
Calculated absorption and scattering properties of gold nanoparticles of different size, shape, and composition: applications in biological imaging and biomedicine.J Phys Chem B. 2006 Apr 13;110(14):7238-48. doi: 10.1021/jp057170o. J Phys Chem B. 2006. PMID: 16599493
-
Surface engineering of inorganic nanoparticles for imaging and therapy.Adv Drug Deliv Rev. 2013 May;65(5):622-48. doi: 10.1016/j.addr.2012.08.015. Epub 2012 Sep 6. Adv Drug Deliv Rev. 2013. PMID: 22975010 Review.
Cited by
-
Phase-sensitive OCT imaging of multiple nanoparticle species using spectrally multiplexed single pulse photothermal excitation.Biomed Opt Express. 2012 Oct 1;3(10):2579-86. doi: 10.1364/BOE.3.002579. Epub 2012 Sep 17. Biomed Opt Express. 2012. PMID: 23082297 Free PMC article.
-
Quantification of differential ErbB1 and ErbB2 cell surface expression and spatial nanoclustering through plasmon coupling.Nano Lett. 2012 Jun 13;12(6):3231-7. doi: 10.1021/nl3012227. Epub 2012 May 21. Nano Lett. 2012. PMID: 22587495 Free PMC article.
-
Comparative review of interferometric detection of plasmonic nanoparticles.Biomed Opt Express. 2013 Sep 16;4(10):2166-78. doi: 10.1364/BOE.4.002166. eCollection 2013. Biomed Opt Express. 2013. PMID: 24156072 Free PMC article.
-
Optical hyperspectral imaging in microscopy and spectroscopy - a review of data acquisition.J Biophotonics. 2015 Jun;8(6):441-56. doi: 10.1002/jbio.201400051. Epub 2014 Sep 3. J Biophotonics. 2015. PMID: 25186815 Free PMC article. Review.
-
Preventing protein adsorption and macrophage uptake of gold nanoparticles via a hydrophobic shield.ACS Nano. 2012 Oct 23;6(10):9182-90. doi: 10.1021/nn3035155. Epub 2012 Sep 25. ACS Nano. 2012. PMID: 23009596 Free PMC article.
References
-
- Kelly K., Coronado E., Zhao L., and Schatz G., “The optical properties of metal NPs: The influence of size, shape, and dielectric environment,” J. Phys. Chem. B 107(3), 668–677 (2003).10.1021/jp026731y - DOI
Publication types
MeSH terms
Substances
Grants and funding
LinkOut - more resources
Full Text Sources
Research Materials
Miscellaneous
