

Sensitivity of Raman spectroscopy to normal patient variability
- PMID: 22112136
- PMCID: PMC3221719
- DOI: 10.1117/1.3646210
Sensitivity of Raman spectroscopy to normal patient variability
Abstract
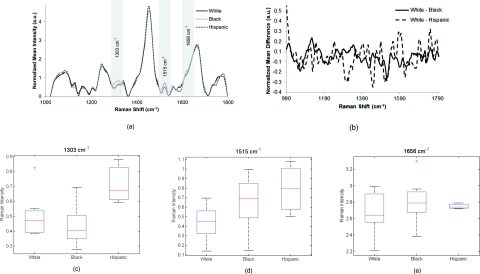
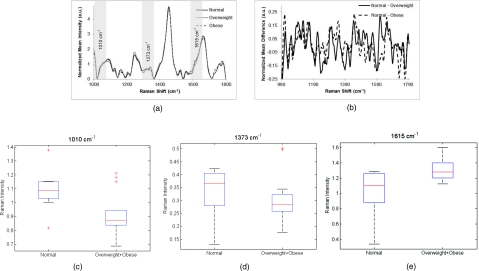
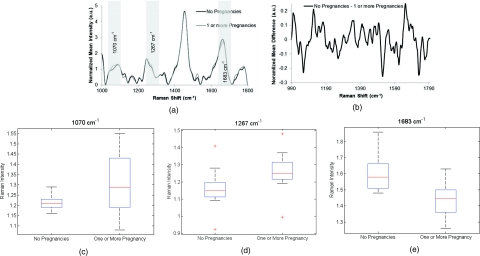
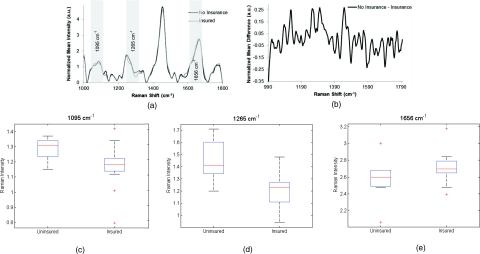
Many groups have used Raman spectroscopy for diagnosing cervical dysplasia; however, there have been few studies looking at the effect of normal physiological variations on Raman spectra. We assess four patient variables that may affect normal Raman spectra: Race/ethnicity, body mass index (BMI), parity, and socioeconomic status. Raman spectra were acquired from a diverse population of 75 patients undergoing routine screening for cervical dysplasia. Classification of Raman spectra from patients with a normal cervix is performed using sparse multinomial logistic regression (SMLR) to determine if any of these variables has a significant effect. Results suggest that BMI and parity have the greatest impact, whereas race/ethnicity and socioeconomic status have a limited effect. Incorporating BMI and obstetric history into classification algorithms may increase sensitivity and specificity rates of disease classification using Raman spectroscopy. Studies are underway to assess the effect of these variables on disease.
Figures
Similar articles
-
Effect of normal variations on disease classification of Raman spectra from cervical tissue.Analyst. 2011 Jul 21;136(14):2981-7. doi: 10.1039/c0an01020k. Epub 2011 Jun 13. Analyst. 2011. PMID: 21666910
-
Effect of hormonal variation on Raman spectra for cervical disease detection.Am J Obstet Gynecol. 2009 May;200(5):512.e1-5. doi: 10.1016/j.ajog.2008.11.024. Epub 2009 Feb 23. Am J Obstet Gynecol. 2009. PMID: 19236872 Free PMC article. Clinical Trial.
-
Characterization of Raman spectra measured in vivo for the detection of cervical dysplasia.Appl Spectrosc. 2007 Sep;61(9):986-93. doi: 10.1366/000370207781746053. Appl Spectrosc. 2007. PMID: 17910796
-
Accuracy of Raman spectroscopy in differentiating brain tumor from normal brain tissue.Oncotarget. 2017 May 30;8(22):36824-36831. doi: 10.18632/oncotarget.15975. Oncotarget. 2017. PMID: 28415660 Free PMC article. Review.
-
Dysplasia and early neoplasia of the uterine cervix. A review.Obstet Gynecol Surv. 1979 Jan;34(1):70-99. Obstet Gynecol Surv. 1979. PMID: 375145 Review. No abstract available.
Cited by
-
Subcellular and macrostructural immediate responders to airblast traumatic brain injury.Sci Rep. 2025 Aug 4;15(1):28454. doi: 10.1038/s41598-025-13288-6. Sci Rep. 2025. PMID: 40759696 Free PMC article.
-
Current Advances in the Application of Raman Spectroscopy for Molecular Diagnosis of Cervical Cancer.Biomed Res Int. 2015;2015:561242. doi: 10.1155/2015/561242. Epub 2015 Jun 9. Biomed Res Int. 2015. PMID: 26180802 Free PMC article. Review.
-
In vivo Raman spectroscopy monitors cervical change during labor.Am J Obstet Gynecol. 2022 Aug;227(2):275.e1-275.e14. doi: 10.1016/j.ajog.2022.02.019. Epub 2022 Feb 19. Am J Obstet Gynecol. 2022. PMID: 35189092 Free PMC article.
-
Near-infrared Raman Microspectroscopy Detects High-risk Human Papillomaviruses.Transl Oncol. 2012 Jun;5(3):172-9. doi: 10.1593/tlo.12106. Epub 2012 Jun 1. Transl Oncol. 2012. PMID: 22741036 Free PMC article.
-
Clinical instrumentation and applications of Raman spectroscopy.Chem Soc Rev. 2016 Apr 7;45(7):1958-79. doi: 10.1039/c5cs00581g. Chem Soc Rev. 2016. PMID: 26999370 Free PMC article. Review.
References
Publication types
MeSH terms
Grants and funding
LinkOut - more resources
Full Text Sources
Other Literature Sources
