. 2012 Jun;13(5):454-66.
doi: 10.1111/j.1364-3703.2011.00761.x. Epub 2011 Nov 24.

RNA-Seq reveals infection-related global gene changes in Phytophthora phaseoli, the causal agent of lima bean downy mildew

Affiliations

RNA-Seq reveals infection-related global gene changes in Phytophthora phaseoli, the causal agent of lima bean downy mildew

Sridhara G Kunjeti et al. Mol Plant Pathol. 2012 Jun.

Abstract

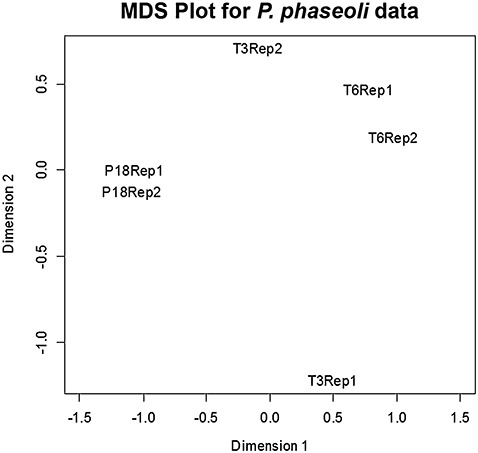
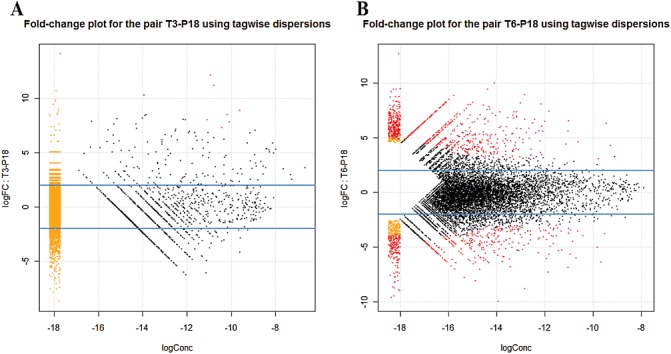
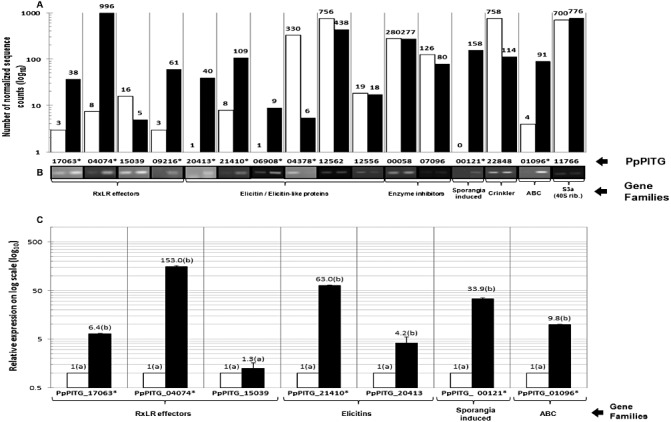
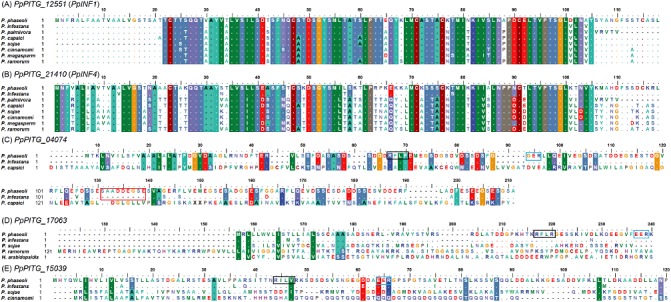
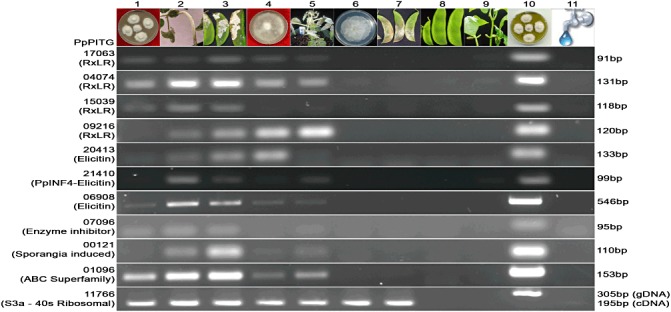
Lima bean is an important vegetable processing crop to the mid-Atlantic USA and is highly susceptible to the oomycete pathogen Phytophthora phaseoli, which causes downy mildew. Genetic resistance and fungicides are used to manage P. phaseoli and often fail. Currently, the molecular basis of the interaction between this host and pathogen is unknown. To begin to rectify this situation, we used Illumina RNA-Seq to perform a global transcriptome analysis comparing P. phaseoli growing in culture with P. phaseoli infecting its host. Sequence reads from a total of six libraries mapped to gene models from the closely related late blight pathogen, Phytophthora infestans, resulting in 10 427 P. phaseoli genes with homology to P. infestans and expression in at least one library. Of these, 318 P. phaseoli homologues matched known or putative virulence genes in P. infestans. Two well-studied classes, RxLRs and elicitins, were up-regulated in planta, whereas the reverse was true for another class, called crinklers. These results are discussed with respect to the differences and similarities in the pathogenicity mechanisms of P. phaseoli and P. infestans.


Figures

Figure 1
Figure 1
Multidimensional scaling (MDS) showing the relationship between replicates in two dimensions (dimensions 1 and 2), generated by edgeR. Two replicates (Rep1 and Rep2) for the samples P18 and T6 are closely related in both dimensions, whereas the T3 replicates are closely related in dimension 1 and separated in dimension 2. Axes x and y are representations of all the gene expression levels between groups based on tissue type and replicates.
Figure 2
Figure 2
Smear plot generated from edgeR showing the log fold change (FC) against the log concentration (Conc) (a summary measure of the average concentration for each tag over all treatment conditions) for each tag, using tagwise dispersion. The most differentially expressed tags are highlighted in red, showing eight for P18–T3 (A) and 1284 for P18–T6 (B). The smear of dots (orange and red) on the left side signifies that genes were observed in only groups of replicate samples.
Figure 3
Figure 3
Confirmation of selected genes in Phytophthora phaseoli for the pair P18–T6. (A) The number of normalized sequence counts (numbers on the respective bars) that mapped to P. infestans genes is shown on a logarithmic y axis. (B) Reverse transcription‐polymerase chain reaction (RT‐PCR) confirmation of genes in (A). PpPITG_11766 encodes a 40S ribosomal protein, and was used as a housekeeping gene (S3a). (C) Expression levels were calculated by the 2(–ΔΔCT) method using plate‐grown P. phaseoli as the calibrator and S3a as the housekeeping gene. Error bars indicate the standard error and the letters ‘a’ and ‘b’ indicate the significance in Student's t‐test. White and black bars represent plate‐grown (P18) and plant‐grown (6 days post‐inoculation) (T6) P. phaseoli, respectively. The genes that were differentially expressed (P < 0.01) are marked with an asterisk. This experiment was performed with three biological replicates.
Figure 4
Figure 4
Alignment of five protein sequences from Phytophthora phaseoli against different Phytophthora species in which a homologue was present, and one additional oomycete, Hyaloperonospora arabidopsidis. Full‐length P. phaseoli homologous sequences were translated using BioEdit. (A) PpINF1; (B) PpINF4; (C) PpPITG_04074, insertion of nine amino acids (red box); (D) PpPITG_17063 with RxLR; (E) PpPITG_15039. Black and blue boxes denote putative RxLR and dEER motifs, respectively.
Figure 5
Figure 5
Reverse transcription‐polymerase chain reaction (RT‐PCR) expression of ten genes in Phytophthora phaseoli, P. infestans and P. capsici. Lanes: 1, plate‐grown P. phaseoli mycelium (cDNA); 2, P. phaseoli mycelium on lima bean hypocotyls (6 days post‐inoculation); 3, P. phaseoli mycelium on lima bean pods (field‐collected); 4, plate‐grown P. infestans mycelium; 5, P. infestans mycelium on tomato; 6, plate‐grown P. capsici; 7, P. capsici mycelium on lima bean pods (field‐collected); 8, lima bean pods challenged with water; 9, lima bean hypocotyls challenged with water; 10, P. phaseoli genomic DNA (gDNA); 11, negative control (water). Gene names are listed on the right and sizes are listed on the left. All sizes were as expected, and the experiment was performed with at least three biological replicates.
Figure 6
Figure 6
Transient assays of four elicitins from Phytophthora phaseoli showing the induction of hypersensitive response (HR)‐like host cell death. (A) Leaves of Nicotiana benthamiana were infiltrated with Agrobacterium tumefaciens (strain GV3101) to express candidate elicitins. Agrobacterium containing INF1 from P. infestans (PGR106INF1) was used as a positive control, and pCambia 1301s and PGR106GFP were used as negative controls. (B) Agrobacterium‐infiltrated leaves from (A) were stained with trypan blue. This experiment was performed with at least three biological replicates and these are representative images taken at 7 and 18 days post‐inoculation (dpi).

Similar articles

Cited by

References

    1. App, F. (1959) The history and economic importance of lima bean downy mildew disease. Proc. Am. Soc. Hortic. Sci. 33, 473–476.
    1. Armstrong, M.R. , Whisson, S.C. , Pritchard, L. , Bos, J.I. , Venter, E. , Avrova, A.O. , Rehmany, A.P. , Böhme, U. , Brooks, K. , Cherevach, I. , Hamlin, N. , White, B. , Fraser, A. , Lord, A. , Quail, M.A. , Churcher, C. , Hall, N. , Berriman, M. , Huang, S. , Kamoun, S. , Beynon, J.L. and Birch, P.R. (2005) An ancestral oomycete locus contains late blight avirulence gene Avr3a, encoding a protein that is recognized in the host cytoplasm. Proc. Natl. Acad. Sci. USA, 102, 7766–7771. - PMC - PubMed
    1. Asmann, Y.W. , Wallace, M.B. and Thompson, E.A. (2008) Transcriptome profiling using next‐generation sequencing. Gastroenterology, 135, 1466–1468. - PubMed
    1. Birch, P.R. , Rehmany, A.P. , Pritchard, L. , Kamoun, S. and Beynon, J.L. (2006) Trafficking arms: oomycete effectors enter host plant cells. Trends Microbiol. 14, 8–11. - PubMed
    1. Blair, J.E. , Coffey, M.D. , Park, S.‐Y. , Geiser, D.M. and Kang, S. (2008) A multi‐locus phylogeny for Phytophthora utilizing markers derived from complete genome sequences. Fungal Genet. Biol. 45, 266–277. - PubMed

Publication types

MeSH terms