. 2011 Nov 24:8:163.
doi: 10.1186/1742-2094-8-163.

Differential regional expression patterns of α-synuclein, TNF-α, and IL-1β; and variable status of dopaminergic neurotoxicity in mouse brain after Paraquat treatment

Affiliations

Differential regional expression patterns of α-synuclein, TNF-α, and IL-1β; and variable status of dopaminergic neurotoxicity in mouse brain after Paraquat treatment

Soham Mitra et al. J Neuroinflammation. .

Abstract

Background: Paraquat (1, 1-dimethyl-4, 4-bipyridium dichloride; PQ) causes neurotoxicity, especially dopaminergic neurotoxicity, and is a supposed risk factor for Parkinson's disease (PD). However, the cellular and molecular mechanisms of PQ-induced neurodegeneration are far from clear. Previous studies have shown that PQ induces neuroinflammation and dopaminergic cell loss, but the prime cause of those events is still in debate.

Methods: We examined the neuropathological effects of PQ not only in substantia nigra (SN) but also in frontal cortex (FC) and hippocampus of the progressive mouse (adult Swiss albino) model of PD-like neurodegeneration, using immunohistochemistry, western blots, and histological and biochemical analyses.

Results: PQ caused differential patterns of changes in cellular morphology and expression of proteins related to PD and neuroinflammation in the three regions examined (SN, FC and hippocampus). Coincident with behavioral impairment and brain-specific ROS generation, there was differential immunolocalization and decreased expression levels of tyrosine hydroxylase (TH) in the three regions, whereas α-synuclein immunopositivity increased in hippocampus, increased in FC and decreased in SN. PQ-induced neuroinflammation was characterized by area-specific changes in localization and appearances of microglial cells with or without activation and increment in expression patterns of tumor necrosis factor-α in the three regions of mouse brain. Expression of interleukin-1β was increased in FC and hippocampus but not significantly changed in SN.

Conclusion: The present study demonstrates that PQ induces ROS production and differential α-synuclein expression that promotes neuroinflammation in microglia-dependent or -independent manners, and produces different patterns of dopaminergic neurotoxicity in three different regions of mouse brain.


Figures

Figure 1
Figure 1
Dose-dependent effects of PQ on survival of mice and identification of a sublethal dose of PQ. Survival of mice indicates number of animals alive after PQ treatment. Intraperitoneal injection of PQ with various doses (5, 10, 20, 40, 80 mg/kg b.w.) caused death of animals at doses of 20, 40 and 80 mg/kg b.w. of PQ. Animals treated with PQ at doses of 5 and 10 mg/kg b.w. remained alive during the entire treatment period, and were sacrificed after the final treatment as described in Methods. Animals treated with 80 mg PQ/kg b.w. died within 8 hours of the 1st dose. Experiments were performed with 10 animals in each group. Error bars represent animals that were alive on different days after treatment of PQ with doses of 20 mg/kg b.w. and 40 mg/kg b.w.
Figure 2
Figure 2
Symptoms of motor dysfunction in mice treated with a sublethal dose (10 mg/kg b.w.) of PQ. PQ caused severe postural instability (A) and gait impairment (B). (A): The curling test evaluated asymmetry in body posture. There was severe hunched-back deviation from the vertical body axis in PQ-treated animals. (B): Representative walking footprint patterns displayed irregular stride length in consecutive steps in treated animals. Control animals followed a straight walking pathway, whereas treated animals deviated from the normal walking pathway within a confined area. (C): Bar graph indicates differential stride length of consecutive steps in PQ-treated animals compared to controls. (D): There were no significant differences in average number of steps (step frequency) for PQ-treated animals compared to vehicle-treated controls. Values in figure C and D represent mean ± SEM (n = 3). Asterisk (*) indicates a significant change in stride length, p < 0.05 (Student's t-test).
Figure 3
Figure 3
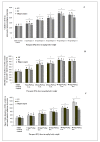
Dose-dependent rise in activity of ROS-scavenging enzymes with PQ treatment in three regions of mouse brain. PQ treatment with different doses of PQ (5, 10, 20, 40, 80 mg/kg b.w.) enhanced the activities of catalase (A), GST (B) and SOD (C) in SN, hippocampus and FC of mouse brain. The activities of the enzymes indicate the status of ROS in tissues as described in the Results and Discussion sections. Enzyme activity is presented as μmole/min/mg protein (for catalase and SOD activity) or as nmole/min/mg protein (for GST activity) as indicated in the figures. Asterisks (*) indicate significant differences (p < 0.05, ANOVA) in values for different doses compared to controls. The same letter indicates nonsignificant differences and different letters indicate significant differences (p < 0.05, Student's t-test) between groups.
Figure 4
Figure 4
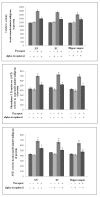
Tocopherol supplementation reduces PQ-induced activation of ROS-scavenging enzymes. The activities of catalase, GST and SOD (A, B and C) were measured in SN, FC and hippocampus of mouse brain after PQ treatment. PQ treatment increased enzyme activities significantly compared to saline-treated controls. The values of enzyme activities after PQ treatment followed by tocopherol supplementation remained significantly lower than PQ-treated values, and were higher than saline-treated control values. Tocopherol supplementation did not alter enzyme activity compared to control values.
Figure 5
Figure 5
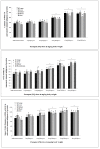
Dose-dependent effects of PQ on ROS-scavenging enzymes in blood plasma and peripheral tissues. Lethal doses of PQ (20, 40, 80 mg/kg b.w.) enhanced the activities of catalase (A), GST (B) and SOD (C) in blood plasma and peripheral tissues (lung, liver and kidney) of mice. The activities of these enzymes indicate the status of ROS in tissues and blood plasma. Enzyme activity is presented as μmole/min/mg protein (for catalase and SOD activity) or as nmole/min/mg protein (for GST activity) as indicated in the figures. Asterisks (*) indicate significant differences (p < 0.05, ANOVA) in values for different doses compared to controls. The same letter indicates nonsignificant differences and different letters indicate significant differences (p < 0.05, student t-test) between groups.
Figure 6
Figure 6
Dose-dependent variable effects of PQ on dopaminergic cell counts in SN. Immunopositivity for FOX3 (A) and TH (B) represent dopaminergic neuronal cells in SN during treatment of mice with different doses of PQ. Different doses of PQ (5, 10, 20, 40 and 80 mg/kg b.w.) decreased cell counts variably in SN with a maximum observed effect at a PQ dose of 10 mg/kg b.w. (a sublethal dose) (C). Details of immunohistochemistry and cell counting are described in Methods. Values are presented as mean ± SEM (n = 3). Asterisks (*) indicate significant differences (p < 0.05, ANOVA) in cell counts for different doses compared to controls. The same letter indicates nonsignificant differences and different letters indicate significant differences (p < 0.05, Student's t-test) between groups.
Figure 7
Figure 7
Histological and morphological changes in three regions of brain after PQ (10 mg/kg b.w.) treatment. Morphological alterations in cells were observed by H&E staining in SN, FC and hippocampus of PQ-treated animal brains compared to controls. The detailed procedure for staining is described in Methods. (A): Formation of pyknotic nuclei (black arrows) is found in SN of PQ-treated mouse brain, but not in vehicle-treated controls. (B): Pyknotic nuclei (black arrows) and Lewy body-like structures (yellow arrows) appeared in FC of PQ-treated mouse brain (b, d, f and h) but not in controls (a, c, e and g respectively). Lewy body-like structures of different shapes with acidophilic central cores were found in four regions of frontal cortex. Lewy body-like structures were round-to-oval-shaped (b, h), or irregular-to-pear-shaped (d, f). (C): Pyknotic nuclei were observed in the hippocampal regions dentate gyrus, CA3 and CA1 in PQ-treated animals (b, d, f respectively) but not in control brain (a, c, e respectively). Magnification is 100× as indicated; scale bars = 10µm.
Figure 8
Figure 8
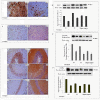
Differential patterns of immunoreactivity of dopaminergic neuronal markers in brain after PQ (10 mg/kg b.w.) treatment. Immunoreactive localization of TH was observed in SN, FC and different parts of the hippocampus (A, B and C, respectively). Densitometric analysis of western blots for FOX3, TH and DOPA decarboxylase (D, E and F respectively) was performed to assess the status of dopaminergic neurons in SN, FC and hippocampus. (A): TH-immunopositive neuronal cells (pigmented) and neurites were decreased in SN of PQ-treated mice (b) compared to controls (a). (B): The cellular localization of TH immunoreactivity shifted from nucleated to non-nucleated neuritic areas in FC in PQ-treated animals (b) compared to controls (a). (C): TH immunopositivity appeared in non-nucleated neuritic areas of the hippocampus (dentate gyrus, CA3 and CA1) in PQ-treated animals (b, d, f respectively) compared to TH immunolocalization in nucleated areas in controls (a, c and e respectively). (D and E): Expression levels of TH decreased in SN, FC and hippocampal areas of PQ-treated mice compared to respective controls (E). PQ treatment caused significant decreases in expression levels of FOX 3 (D) and DOPA decarboxylase (F) in SN and FC, without any changes of those parameters in hippocampus, compared to respective controls. β-Actin was used as a reference control in the western blots. Data are presented as mean ± SEM. (n = 3). Asterisks (*) represent significant differences at a level of p < 0.05 (Student's t-test) for the densitometric analyses. Magnification of IHC images is 40×, and the scale bars = 40µm.
Figure 9
Figure 9
Differential patterns of α-synuclein immunoreactivity after PQ (10 mg/kg b.w.) treatment. α-Synuclein immunolocalization in SN, FC and hippocampus (A, B and C, respectively). (D) Densitometric analysis of western blot α-synuclein in SN, FC and hippocampus. (A): α-Synuclein immunopositivity was dense in neuritic areas of SN in controls (a). α-Synuclein immunopositivity decreased in neuritic areas, and a few pigmented nuclear structures (putative Lewy bodies) appeared (black arrows) in SN of PQ-treated animals (b). (B): α-Synuclein immunoreactivity in neuritic areas of FC in PQ-treated and control animals. Large numbers of pigmented nuclear structures (putative Lewy bodies) appeared (black arrows) in FC of PQ-treated brain (b), compared to vehicle-treated controls (a). (C): Non-nucleated areas (neuritic portions) but not nucleated areas, of hippocampus showed α-synuclein immunopositivity in both control and treated animals. Dense α-synuclein immunoreactivity appeared in non-nucleated areas of hippocampal regions CA3 and CA1 (b, d, respectively) in PQ-treated mouse brain compared to controls (a, c, respectively). A few pigmented deposits (putative Lewy bodies) were found in non-nucleated areas of hippocampal regions of PQ-treated animals, but not in respective controls. (D): Densitometric analysis of western blots indicate that expression levels of α-synuclein decreased significantly in SN, increased significantly in hippocampus and were unaltered in FC of PQ-treated animals, compared to controls. β-Actin was used as a reference control. Data are presented as mean ± SEM. (n = 3). Asterisks (*) represent significant differences, with p < 0.05 (Student's t-test) in densitometric analyses. Magnification of IHC images is 40× and the scale bars = 40µm.
Figure 10
Figure 10
Differential patterns of IL-1β immunoreactivity in brain after PQ (10 mg/kg b.w.) treatment. IL-1β immunolocalization was assessed in SN, FC and hippocampus (A, B and C respectively). Densitometric analysis of western blots for IL-1β (D) was performed to assess expression levels for IL-1β in SN, FC and hippocampus. (A): IL-1β immunoreactivity is dispersed in SN of PQ-treated animals (b) compared to controls (a). Immunoreactive deposits are found in a distinct population of small, rounded cells (putative microglia, black arrows) rather than nucleated neuronal cells, in SN of PQ-treated animals, but not in controls. (B): A diffuse pattern of IL-1β immunoreactivity appeared in FC of PQ-treated animal (d) with more intense immunoreaction compared to controls (c). (C): Both nucleated and non-nucleated areas of hippocampus (dentate gyrus, CA3 and CA1; b, d, f respectively) of PQ-treated brain show more intense IL-1β immunoreactivity compared to controls (a, c and e respectively). Nucleated areas of hippocampus of PQ-treated mice showed dense immunoreaction compared to non-nucleated areas (b, d and f). (D): Densitometric analysis of western blots indicates that expression levels of IL-1β increased significantly both in FC and hippocampus without any change in SN of PQ-treated animals, compared to controls. β-Actin was used as a reference control in western blots. Data are presented as mean ± SEM (n = 3). Asterisks (*) represent significant differences at a level of p < 0.05 (Student's t-test) for densitometric analses. Magnification of IHC images is 40× and the scale bars = 40µm.
Figure 11
Figure 11
PQ (10 mg/kg b.w.) treatment increases TNF-α immunoreactivity in brain. TNF-α immunolocalization was assessed in SN, FC and hippocampus (A, B and C respectively). Densitometric analyses of western blots for TNF-α (D) were performed to assess expression levels of TNF-α in SN, FC and hippocampus. (A): TNF-α immunoreactivity was more intense in SN of PQ-treated animals (b) compared to controls (a). TNF-α immunopositivity was found in both neuritic areas and in large, oval-shaped cells (putative microglia-macrophages, black arrows) in SN of PQ-treated animals (b). (B): The FC of PQ-treated animals (b) showed more intense TNF-α immunoreactivity compared to controls (a). Immunoreaction appeared in neurites and in small round cells (putative microglia, black arrows) in FC of PQ-treated animals (b). (C): TNF-α immunoreactivity was found in both nucleated and non-nucleated areas of hippocampus, with more intense immunoreaction in hippocampal regions of PQ-treated animals (dentate gyrus, CA3 and CA1; b, d and f respectively). TNF-α immunopositive small round cells (putative microglia, black arrows) appeared in both nucleated and non-nucleated areas of hippocampus of PQ-treated animals (b, d and f). (D): Densitometric analyses of western blots indicate that TNF-α expression levels increased significantly in all three regions (SN, FC and hippocampus) of PQ-treated animals compared to controls. β-Actin was used as a reference control in western blots. Data are presented as mean ± SEM (n = 3). Asterisks (*) represent significant differences at a level of p < 0.05 (Student's t-test) for densitometric analyses. Magnification of IHC images is 40× and the scale bars = 40µm.
Figure 12
Figure 12
Tocopherol supplementation reduces PQ (10 mg/kg b.w.)-induced TNF-α overexpression. TNF-α immunolocalization in SN, FC and hippocampus after PQ treatment with or without tocopherol supplementation (A, B and C respectively). Densitometric analyses of western blots indicate that tocopherol supplementation reduced expression levels of TNF-α significantly in SN, hippocampus, and FC of PQ-treated animals compared to PQ-treated animals without tocopherol. (A): TNF-α immunoreactivity of oval-shaped cells (microglia-macrophages) appeared in SN after PQ treatment (a), and this was reduced by α-tocopherol (b). (B): TNF-α immunopositivity appeared in microglia-like cells in FC after PQ treatment (a), and this was reduced by tocopherol (b). (C): TNF-α immunoreactivity appeared in both nucleated and non-nucleated areas of hippocampal regions CA1, CA3, and dentate gyrus (a, c and e respectively) after PQ treatment (b, d and f respectively). PQ treatment followed by tocopherol reduced TNF-α immunoreactivity in nucleated and non-nucleated areas of hippocampus (b, d and f respectively). (D): Densitometric analyses of western blots indicate that PQ treatment increased TNF-α expression levels in SN, FC and hippocampus compared to respective saline-treated control. Expression of TNF-α in the three regions remained unaltered after PQ treatment followed by tocopherol, compared to controls. Tocopherol did not alter TNF-α expression compared to saline-treated controls. β-Actin was used as a reference control in western blots. Data are presented as mean ± SEM. (n = 3). Asterisks (*) represents significant differeneces at a level of p < 0.05 (Student's t-test) for densitometric analyses. Magnification of IHC images is 40× and the scale bars = 40µm.
Figure 13
Figure 13
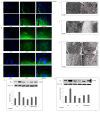
Microglial activation after PQ (10 mg/kg b.w.) treatment. Iba 1 immunolocalization (microglial marker) in SN, FC and hippocampus (A, B and C respectively; Weil and Davenport's method -- gray scale) in SN, FC and hippocampus (E, F and G respectively). Densitometric analyses of western blots for Iba 1 and Mac1 (microglial activation marker) to assess expression levels in SN, FC and hippocampus (D and H respectively): (A) intensity of Iba 1 immunofluorescence increased in SN of PQ-treated animals; (B, C) intensity of Iba 1 immunofluorescence decreased in FC (B) and hippocampus (C) of PQ-treated animals. (D) Densitometric analyses of western blots: Iba 1 expression increased significantly in SN, decreased in FC and remained unaltered in hippocampus of PQ-treated mice compared to vehicle-treated controls. (E, F and G): Silver staining revealed a reactive phenotype for microglia (red arrow), which appeared in SN as aggregated forms (b) in PQ-treated brain (E). Silver-impregnated microglia decreased in FC of PQ-treated animals (F). Aggregated forms of microglia appeared in hippocampus (G) of PQ-treated brain, but not controls. (H) Densitometric analyses of western blots indicate that Mac1expression increased significantly in SN, decreased significantly in FC and remained unchanged in hippocampus of PQ-treated animals. β-Actin was used as a reference control in western blots. Data are presented as mean ± SEM (n = 3). Asterisks (*) represent significant differences at a level of p < 0.05 (Student's t-test) for densitometric analyses. Magnification of immunofluorescence images is 10× and magnification of silver-stained images is 40×; the scale bars = 40 µm.

Similar articles

Cited by

References

    1. González-Polo RA, Rodríguez-Martín A, Morán JM, Niso M, Soler G, Fuentes JM. Paraquat-induced apoptotic cell death in cerebellar granule cells. Brain Res. 2004;1011:170–176. doi: 10.1016/j.brainres.2004.02.078. - DOI - PubMed
    1. Chinta SJ, Rane A, Poksay KS, Bredesen DE, Andersen JK, Rao RV. Coupling endoplasmic reticulum stress to the cell death program in dopaminergic cells: effect of paraquat. Neuromol Med. 2008;10:333–342. doi: 10.1007/s12017-008-8047-9. - DOI - PMC - PubMed
    1. Niso-Santano M, González-Polo RA, Bravo-San Pedro JM, Gómez-Sánchez R, Lastres-Becker I, Ortiz-Ortiz MA, Soler G, Morán JM, Cuadrado A, Fuentes JM. Activation of apoptosis signal-regulating kinase 1 is a key factor in paraquat-induced cell death: Modulation by the Nrf2/Trx axis. Free Rad Biol Med. 2010;48:1370–1381. doi: 10.1016/j.freeradbiomed.2010.02.024. - DOI - PubMed
    1. Franco R, Li S, Rodriguez-Rocha H, Burns M, Panayiotidis MI. Molecular mechanisms of pesticide-induced neurotoxicity: Relevance to Parkinson's disease. Chem Biol Interact. 2010;188:289–300. doi: 10.1016/j.cbi.2010.06.003. - DOI - PMC - PubMed
    1. Chanyachukul T, Yoovathaworn K, Thongsaard W, Chongthammakun S, Navasumrit P, Satayavivad J. Attenuation of paraquat-induced motor behavior and neurochemical disturbances by l-valine in vivo. Toxicol Lett. 2004;150:259–269. doi: 10.1016/j.toxlet.2004.02.007. - DOI - PubMed

Publication types

MeSH terms

LinkOut - more resources