. 2011 Nov 24;2(11):e234.
doi: 10.1038/cddis.2011.121.

Specificity protein, Sp1-mediated increased expression of Prdx6 as a curcumin-induced antioxidant defense in lens epithelial cells against oxidative stress

Affiliations

Specificity protein, Sp1-mediated increased expression of Prdx6 as a curcumin-induced antioxidant defense in lens epithelial cells against oxidative stress

B Chhunchha et al. Cell Death Dis. .

Abstract

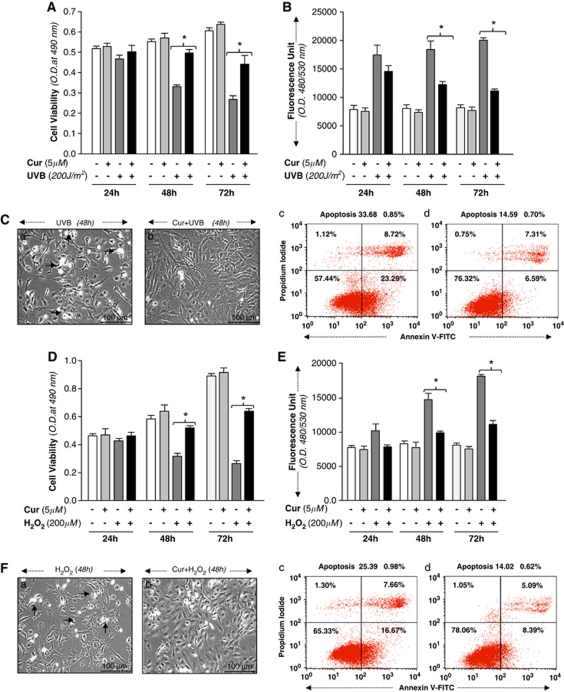
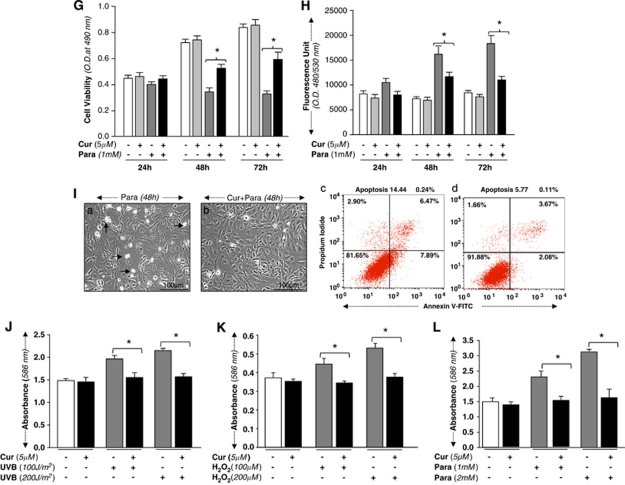
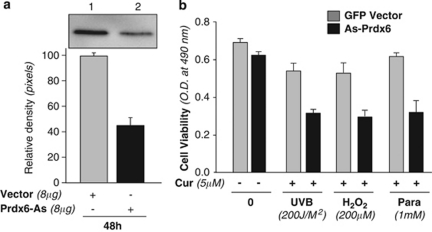
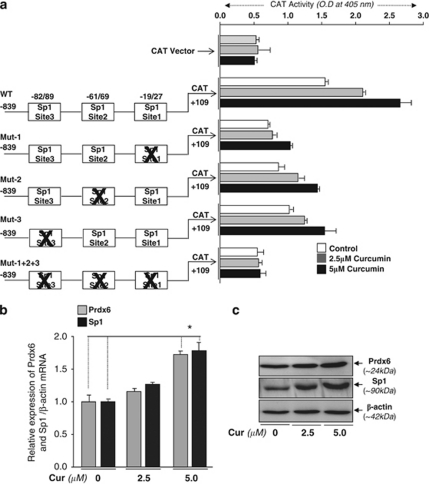
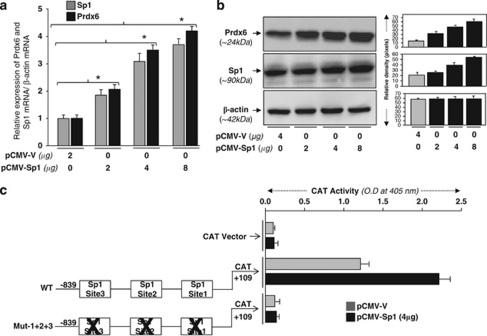
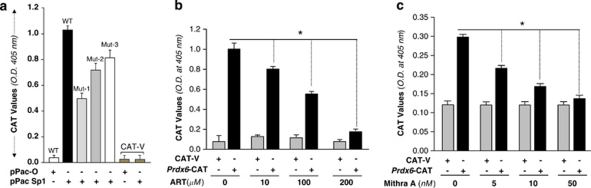
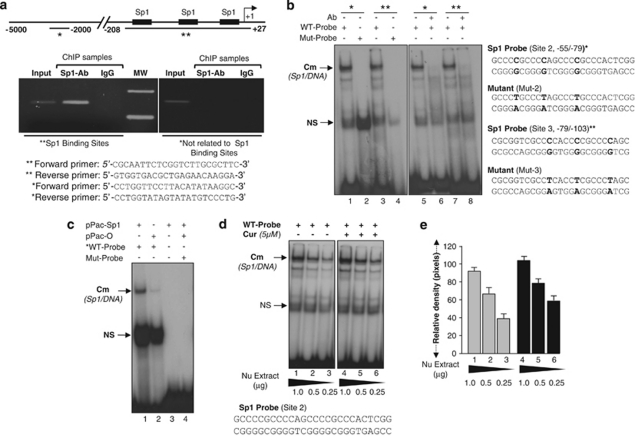
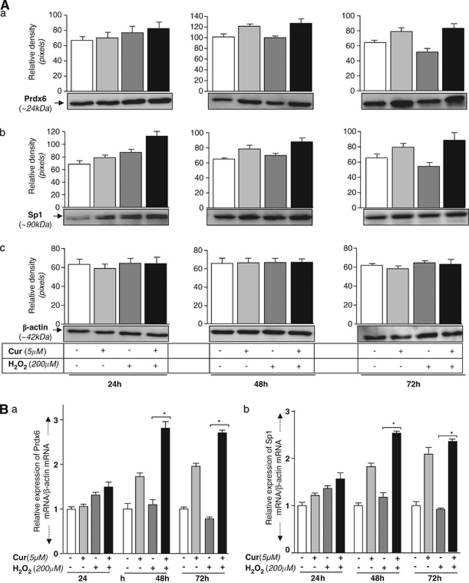
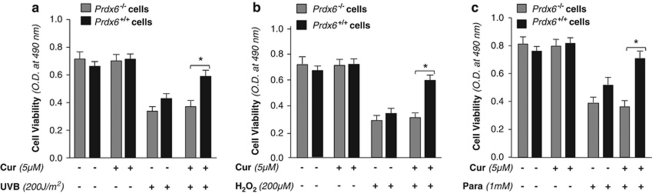
Peroxiredoxin 6 (Prdx6) is a pleiotropic oxidative stress-response protein that defends cells against reactive oxygen species (ROS)-induced damage. Curcumin, a naturally occurring agent, has diversified beneficial roles including cytoprotection. Using human lens epithelial cells (hLECs) and Prdx6-deficient cells, we show the evidence that curcumin protects cells by upregulating Prdx6 transcription via invoking specificity protein 1 (Sp1) activity against proapoptotic stimuli. Curcumin enhanced Sp1 and Prdx6 mRNA and protein expression in a concentration-dependent manner, as evidenced by western and real-time PCR analyses, and thereby negatively regulated ROS-mediated apoptosis by blunting ROS expression and lipid peroxidation. Bioinformatic analysis and DNA-protein binding assays disclosed three active Sp1 sites (-19/27, -61/69 and -82/89) in Prdx6 promoter. Co-transfection experiments with Sp1 and Prdx6 promoter-chloramphenicol acetyltransferase (CAT) constructs showed that CAT activity was dramatically increased in LECs or Sp1-deficient cells (SL2). Curcumin treatment of LECs enhanced Sp1 binding to its sites, consistent with curcumin-dependent stimulation of Prdx6 promoter with Sp1 sites and cytoprotection. Notably, disruption of Sp1 sites by point mutagenesis abolished curcumin transactivation of Prdx6. Also, curcumin failed to activate Prdx6 expression in the presence of Sp1 inhibitors, demonstrating that curcumin-mediated increased expression of Prdx6 was dependent on Sp1 activity. Collectively, the study may provide a foundation for developing transcription-based inductive therapy to reinforce endogenous antioxidant defense by using dietary supplements.


Figures

Figure 1
Figure 1
(A) Curcumin protected hLECs against UVB exposure, optimized ROS expression and reduced apoptotic cell death. Increase in survival of curcumin-treated hLECs exposed to UVB. Cells were treated with 5 μM of curcumin or dimethyl sulfoxide (DMSO) (a control vehicle). After 12 h, cells were submitted to UVB (200 J/m2), and effects on cell growth and viability were determined after 24, 48 and 72 h by MTS assay. (B) Effect of curcumin on lowering ROS expression. Cells were treated with DMSO or 5 μM of curcumin and after 12 h were exposed to UVB (200 J/m2). ROS expression was measured at 24, 48 and 72 h by replacing the medium with Hank's medium containing 10 μM H2-DCF-DA at Ex485/Em530 nm. (C, left panel) hLECs 7 × 10⁵ were cultured and pretreated with DMSO (a) or curcumin (Cur; b) and then exposed to UVB (200 J/m2). After 48 h, cells were photomicrographed. Arrows indicate dead cells. (Right panel) Cells were trypsinized and the percentage of apoptotic cells was monitored by Annexin V-FITC staining, followed by fluorescence-activated cell sorter (FACS) analysis. A representative photomicrograph (left panel) and FACS analysis of Annexin V-FITC and PI staining were provided. Results are expressed as mean±S.D. for three replicate determinations for each treatment group, and were significant (P<0.001) compared with solvent (DMSO) control indicated by an asterisk (*). (D) Curcumin enhanced cell viability and blunted ROS expression and apoptotic cell death. hLECs 2 × 10⁴ were cultured in 48-well plate and treated with curcumin (5 μM) or DMSO (control vehicle). Cells were subjected to H2O2 (200 μM). Cell viability was tested with MTS assay at 24, 48 and 72 h. (E) Curcumin attenuation of ROS induction by H2O2. hLECs 1 × 10⁴ were cultured in 96-well plate, treated with curcumin (5 μM) and exposed to H2O2 (200 μM). ROS expression was quantified with H2-DCF-DA fluorescence dye at Ex485/Em530 nm with plate reader; results are presented as a histogram. (F) Curcumin negatively regulated the vulnerability of hLECs to H2O2-evoked apoptotic cell death. DMSO- or curcumin-treated hLECs were cultured and exposed to H2O2 (200 μM). After 48 h, cells were trypsinized and the percentage of apoptotic cells was monitored by Annexin V binding assay, followed by FACS analysis. (Left panel) Representative photomicrograph of H2O2-induced apoptosis in untreated (a) and curcumin-treated (b) cells. Arrow denotes dead cell. (Right panel) Representative FACS analysis of Annexin V-FITC and PI staining with control vehicle DMSO (c) and curcumin (d). Experiments were performed in triplicate and repeated at least three times, and the results are expressed as means±S.D. (*P<0.001). (G) Curcumin potentiated hLECs viability by blocking ROS generation and progression of apoptosis against paraquat-induced insults. Curcumin- or DMSO-treated hLECs cultured in 48-well plates containing medium were subjected to paraquat (1 mM), an oxidative stressor. Cell viability assay (MTS assay) was performed at 24, 48 and 72 h. The histogram is representative of three experiments. (H) Curcumin limited paraquat-induced ROS expression in LECs. hLECs cultured in 96-well plate were treated with DMSO (vehicle) or curcumin (5 μM), and submitted to H2-DCF-DA dye, ROS expression assay (24, 48 and 72 h) following paraquat addition as described earlier. The histogram is representative of fluorescence, which is directly proportional to intracellular ROS levels. (I) Curcumin protected hLECs from apoptotic cell death caused by paraquat-induced oxidative damage. Photomicrograph represents hLECs treated with DMSO (a) and curcumin (b) following paraquat addition. Arrow indicates white rounded dead cell (left panel). (Right panel) Representative FACS analysis of Annexin V-FITC and PI staining. hLECs were cultured and pretreated with curcumin (Cur) for 12 h and then exposed to paraquat (1 mM). After 48 h, cells were trypsinized and the percentage of apoptotic cells was monitored by Annexin V binding assay, followed by FACS analysis. Data were derived from three experiments and expressed as means±S.D. *P<0.001. (J) or (K) or (L) Curcumin delivery to cultured hLECs attenuated UVB-, H2O2- or paraquat-induced LPO process in hLECs. Cells were either treated with DMSO (a control vehicle) or curcumin (5 μM), or then exposed to stressors, UVB (J) or H2O2 (K) or paraquat (L) to generate oxidative stress. After 48 h, cells were assessed for levels of LPO using LPO assay as ascribed in commercial kit. Histogram values are mean±S.D. of three independent experiments. Asterisks indicate statistically significant difference (P<0.001 versus control). The results were derived from three experiments
Figure 1
Figure 1
(A) Curcumin protected hLECs against UVB exposure, optimized ROS expression and reduced apoptotic cell death. Increase in survival of curcumin-treated hLECs exposed to UVB. Cells were treated with 5 μM of curcumin or dimethyl sulfoxide (DMSO) (a control vehicle). After 12 h, cells were submitted to UVB (200 J/m2), and effects on cell growth and viability were determined after 24, 48 and 72 h by MTS assay. (B) Effect of curcumin on lowering ROS expression. Cells were treated with DMSO or 5 μM of curcumin and after 12 h were exposed to UVB (200 J/m2). ROS expression was measured at 24, 48 and 72 h by replacing the medium with Hank's medium containing 10 μM H2-DCF-DA at Ex485/Em530 nm. (C, left panel) hLECs 7 × 10⁵ were cultured and pretreated with DMSO (a) or curcumin (Cur; b) and then exposed to UVB (200 J/m2). After 48 h, cells were photomicrographed. Arrows indicate dead cells. (Right panel) Cells were trypsinized and the percentage of apoptotic cells was monitored by Annexin V-FITC staining, followed by fluorescence-activated cell sorter (FACS) analysis. A representative photomicrograph (left panel) and FACS analysis of Annexin V-FITC and PI staining were provided. Results are expressed as mean±S.D. for three replicate determinations for each treatment group, and were significant (P<0.001) compared with solvent (DMSO) control indicated by an asterisk (*). (D) Curcumin enhanced cell viability and blunted ROS expression and apoptotic cell death. hLECs 2 × 10⁴ were cultured in 48-well plate and treated with curcumin (5 μM) or DMSO (control vehicle). Cells were subjected to H2O2 (200 μM). Cell viability was tested with MTS assay at 24, 48 and 72 h. (E) Curcumin attenuation of ROS induction by H2O2. hLECs 1 × 10⁴ were cultured in 96-well plate, treated with curcumin (5 μM) and exposed to H2O2 (200 μM). ROS expression was quantified with H2-DCF-DA fluorescence dye at Ex485/Em530 nm with plate reader; results are presented as a histogram. (F) Curcumin negatively regulated the vulnerability of hLECs to H2O2-evoked apoptotic cell death. DMSO- or curcumin-treated hLECs were cultured and exposed to H2O2 (200 μM). After 48 h, cells were trypsinized and the percentage of apoptotic cells was monitored by Annexin V binding assay, followed by FACS analysis. (Left panel) Representative photomicrograph of H2O2-induced apoptosis in untreated (a) and curcumin-treated (b) cells. Arrow denotes dead cell. (Right panel) Representative FACS analysis of Annexin V-FITC and PI staining with control vehicle DMSO (c) and curcumin (d). Experiments were performed in triplicate and repeated at least three times, and the results are expressed as means±S.D. (*P<0.001). (G) Curcumin potentiated hLECs viability by blocking ROS generation and progression of apoptosis against paraquat-induced insults. Curcumin- or DMSO-treated hLECs cultured in 48-well plates containing medium were subjected to paraquat (1 mM), an oxidative stressor. Cell viability assay (MTS assay) was performed at 24, 48 and 72 h. The histogram is representative of three experiments. (H) Curcumin limited paraquat-induced ROS expression in LECs. hLECs cultured in 96-well plate were treated with DMSO (vehicle) or curcumin (5 μM), and submitted to H2-DCF-DA dye, ROS expression assay (24, 48 and 72 h) following paraquat addition as described earlier. The histogram is representative of fluorescence, which is directly proportional to intracellular ROS levels. (I) Curcumin protected hLECs from apoptotic cell death caused by paraquat-induced oxidative damage. Photomicrograph represents hLECs treated with DMSO (a) and curcumin (b) following paraquat addition. Arrow indicates white rounded dead cell (left panel). (Right panel) Representative FACS analysis of Annexin V-FITC and PI staining. hLECs were cultured and pretreated with curcumin (Cur) for 12 h and then exposed to paraquat (1 mM). After 48 h, cells were trypsinized and the percentage of apoptotic cells was monitored by Annexin V binding assay, followed by FACS analysis. Data were derived from three experiments and expressed as means±S.D. *P<0.001. (J) or (K) or (L) Curcumin delivery to cultured hLECs attenuated UVB-, H2O2- or paraquat-induced LPO process in hLECs. Cells were either treated with DMSO (a control vehicle) or curcumin (5 μM), or then exposed to stressors, UVB (J) or H2O2 (K) or paraquat (L) to generate oxidative stress. After 48 h, cells were assessed for levels of LPO using LPO assay as ascribed in commercial kit. Histogram values are mean±S.D. of three independent experiments. Asterisks indicate statistically significant difference (P<0.001 versus control). The results were derived from three experiments
Figure 2
Figure 2
Reduced expression of Prdx6 affected the protective potential of curcumin against stressors. hLECs were transfected with Prdx6-As or empty vector., After 48 h, cells of each group were pooled and harvested in 48-well plate, and subjected to stressors, followed by survival assay. A fraction of cells from each pool were used to assess the expression levels of Prdx6. (a) Western analysis of vector- (lane 1) and Prdx6-As- (lane 2) transfected cells. (b) Histogram showing the values of MTS assay of vector and Prdx6-As-transfected cells following curcumin treatment. Results are mean±S.D. of three experiments
Figure 3
Figure 3
A construct linking the 5′-proximal regulator region of the Prdx6 promoter to CAT reporter gene. The sequence ranging from nucleotides −839 to +109 contains three putative Sp1 binding sites as predicted by MatInspector (Genomatix), a Web-based computer analysis program. The consensus sequences for the predicted Sp1 sites (G/C-boxes) are shown in bold. Asterisks denote sites of Sp1, and the sites were mutated to examine the binding affinity of each site to Sp1 and their contribution in promoter activity. Underlining is used to show the oligonucleotides employed in gel-shift and gel-shift deletion assays. Nucleotides in italics reflect primer pair used for ChIP experiments. The transcription start site is indicated by +1, and SacI and XhoI restriction sites used for marking Prdx6-CAT-constructs are shown in bold
Figure 4
Figure 4
(a) Induction of Sp1-mediated transcriptional activation on the Prdx6 gene promoter by curcumin in hLECs. (Left half) Schematic representation of Sp1-site-directed mutants of Prdx6 promoter linked to CAT. (Right half) CAT activity of the mutant constructs (Mut 1 to Mut 1+2+3) and empty CAT vector in hLECs untreated (open bars) and curcumin-treated (2.5 μM, gray bars; 5 μM, black bars). Values of empty CAT vector were insignificant. All data are presented as the mean±S.D. derived from three independent experiments. Curcumin-mediated increased expression of Prdx6 mRNA and protein was Sp1 expression-dependent. hLECs were treated with 2.5 and 5 μM of curcumin or dimethyl sulfoxide (DMSO) (control vehicle). After 48 h, RNA and protein were isolated and real-time polymerase chain reaction (PCR) (b) and western analysis (c) were performed. (a) Histogram represents the data mean±S.D. obtained from three independent experiments. (c) Expression levels of Prdx6 (upper panel) and Sp1 (middle panel) following the treatment with curcumin. Lower panel shows the protein bands of β-actin. *P<0.001
Figure 5
Figure 5
LECs overexpressing Sp1 displayed elevated expression of Prdx6 mRNA and protein. hLECs were transfected either with pCMV-vector (4 μg) or pCMV-Sp1 (2, 4 and 8 μg). RNA and protein were isolated at 48 h and were used to conduct real-time polymerase chain reaction (PCR) (a) and western analysis (b), respectively, using Prdx6-specific probes. (a) Histogram showing the values mean±S.D. obtained from three experiments. (b, left panel) Western analysis data showing the expression levels of Prdx6 (upper panel) in cells transfected with Sp1 plasmid at different concentrations (middle panel). (Lower panel) Membrane probed with β-actin antibody. The same membrane was probed and reprobed with antibodies following stripping and restriping to obtain relative expression of Sp1 or Prdx6 or β-actin. (Right panel) Histogram displays relative-protein band density. (c) hLECs co-transfected with Sp1 showed increased CAT activity of Prdx6 promoter. Cells were co-transfected with Prdx6-CAT or its mutant at all three Sp1 sites (4 μg) and pCMV-Sp1 (4 μg). After 72 h, CAT-ELISA was performed. (Right panel) Histogram represents the results from three independent experiments. Values of empty CAT vector were insignificant. Left panel configures the identity of wild-type and mutant constructs of Prdx6 promoter. All data are presented as the mean±S.D. from at least three independent experiments. Asterisk denotes statistically significant difference (P<0.001)
Figure 6
Figure 6
Activation of Prdx6-CAT promoter in Sp1-deficient Schneider cells (SL2) when expressed with Sp1 by pPac-Sp1 transfection. (a) SL2 cells were co-transfected with pPac-Sp1or pPac-0 (1 μg) along with Prdx6-CAT (2 μg) or its mutant promoter at Sp1 sites. After 48 h, CAT activities were measured. The histogram represents the results from four independent experiments. (b and c) ART and Mithra-A, inhibitors of Sp1, inhibit transcriptional activity of Prdx6 gene promoter in hLECs. Cells were transfected with Prdx6-CAT or empty CAT vector construct and treated with ART (b) or Mithra-A (c) at different concentrations. The Histogram represents the values derived from experiments. Transfection efficiencies were normalized with a plasmid secreted alkaline phosphatase basic vector. The data represent the mean±S.D. from three independent experiments. Asterisks indicate statistically significant differences (P<0.001)
Figure 7
Figure 7
(a) ChIP analysis revealed that Sp1 bound to Prdx6 promoter in vivo. ChIP assay was carried out by using ChIP-IT Express (Active Motif, Carlsbad, CA, USA). (Upper half) Schematic illustration of proximal promoter region of Prdx6-containing Sp1 binding sites. Chromatin samples prepared from LECs subjected to ChIP assay with a ChIP grade antibody against Sp1 or control IgG. The DNA fragments were used as templates and amplified by using primers designed to amplify −208 to +27 region of the Prdx6 promoter bearing Sp1 sites (**) and contiguous sequence (−2229 to −2356) to which Sp1 does not bind (*). Polymerase chain reaction (PCR) products were resolved into agarose gel and visualized with ethidium bromide staining. (Lower panel) Photograph of the amplified DNA band visualized with ethidium bromide staining. MW, molecular weight marker. (Lower half) Primers used for amplification of specific region containing Sp1 sites (**) and not related to Sp1 binding Sp1 sites (*). (b) Sp1 in the nuclear extract of hLECs bound directly to its responsive elements in the Prdx6 promoter. (Left panel) Gel-shift assay was conducted with the nuclear extracts isolated from hLECs and radiolabeled probes derived from Prdx6 promoter containing Sp1 sites. A Cm (Sp1/DNA) complex occurred (lanes 1, 3, 5 and 6) with wild-type (WT) probes; in contrast, no complex formation could be detected with mutant probe (lanes 2 and 4). (Right panel) Antibody depletion assay showing ablation of DNA and Sp1 complex (Cm). Nuclear extracts isolated from cells were incubated with antibody specific to Sp1 at 4°C. Following centrifugation, extracts were processed for gel-shift assay. No band was detected when Sp1-specific antibody was added to deplete Sp1 in nuclear extract with either of the probes with Sp1 sites (lanes 6 and 8). Bold bases denote mutated base(s). (c) Protein extracted from SL2 cells expressed with Sp1 bound to Sp1-responsive elements in Prdx6 promoter. Sp1-deficient SL2 cells were transfected with pPac-Sp1 or pPac-0 plasmids. Protein was extracted and processed with radiolabeled probes containing Sp1 sites. Reaction mix was subjected to gel-shift assay. A Cm complex was formed with extract from pPac-Sp1-transfected cells (lane 1); in contrast, no complex was evident with extracts from pPac-0-transfected cells or mutant probes (lanes 2–4). (d) Curcumin ameliorated the interaction of Sp1 with its responsive elements in the Prdx6 promoter. hLECs were cultured in the presence of dimethyl sulfoxide (DMSO) (control vehicle) or curcumin and nuclear extracts were isolated as described, and were processed for gel-shift assay using radiolabeled probes with Sp1 sites. A strong Cm (Sp1/DNA) complex occurred in cells treated with curcumin (lanes 4–6), in comparison to untreated cells (lanes 1–3). (e) Histogram represents densitometry analysis of DNA–protein complex
Figure 8
Figure 8
Curcumin promoted Sp1-dependent increased expression of Prdx6 protein and mRNA in hLECs facing oxidative stress. (A) Cells were exposed to 5 μM curcumin or control vehicle (dimethyl sulfoxide (DMSO)) and submitted to H2O2- (200 μM)induced oxidative stress. Cell extracts were isolated for 24, 48 and 72 h, and resolved on sodium dodecyl sulfate-polyacrylamide gel electrophoresis (SDS-PAGE), followed by western analysis with Prdx6 (a), Sp1 (b) or β-actin (c) antibody. The histogram displays relative-protein band density. (B) Real-time polymerase chain reaction (PCR) showing expression levels of Prdx6 and Sp1 mRNA. RNA was isolated from untreated or curcumin-treated hLECs at 24, 48 or 72 h following H2O2 exposure. Real-time PCR was carried out using specific primers corresponding to Prdx6 (a) or Sp1 (b) or β-actin as internal control. Values are represented as a histogram, obtained from three independent experiments. Asterisk denotes statistically significant difference (P<0.001). Similar results were obtained from the experiments with UVB and paraquat (data not shown)
Figure 9
Figure 9
Prdx6-deficient cells provided evidence that curcumin exerted its cytoprotective action via upregulation of Prdx6 expression in hLECs facing oxidative stresses. Wild-type (Prdx6+/+) and knockout (Prdx6−/−) LECs were cultured in 48-well plate containing DMEM medium with or without curcumin (5 μM). Cells were submitted to oxidative stressors UVB (200 J/m2) (a), or H2O2 (200 μM) (b) or paraquat (1 mM) (c). Following incubation for 48 h, viability of cells was assessed using MTS assay. Representative histograms displaying relative viability of untreated or curcumin-treated Prdx6−/− (gray bars) and Prdx6+/+ (black bars) LECs following oxidative stress. Asterisk denotes statistically significant difference (P<0.001)

Similar articles

Cited by

References

    1. Balasubramanian D. Ultraviolet radiation and cataract. J Ocul Pharmacol Ther. 2000;16:285–297. - PubMed
    1. Kubo E, Fatma N, Akagi Y, Beier DR, Singh SP, Singh DP. TAT-mediated PRDX6 protein transduction protects against eye lens epithelial cell death and delays lens opacity. Am J Physiol Cell Physiol. 2008;294:C842–C855. - PubMed
    1. Fatma N, Singh P, Chhunchha B, Kubo E, Shinohara T, Bhargavan B, et al. Deficiency of Prdx6 in lens epithelial cells induces ER stress response-mediated impaired homeostasis and apoptosis. Am J Physiol Cell Physiol. 2011;301:C954–C967. - PMC - PubMed
    1. Fisher AB. Peroxiredoxin 6: a bifunctional enzyme with glutathione peroxidase and phospholipase A activities. Antioxid Redox Signal. 2011;15:831–844. - PMC - PubMed
    1. Valko M, Leibfritz D, Moncol J, Cronin MT, Mazur M, Telser J. Free radicals and antioxidants in normal physiological functions and human disease. Int J Biochem Cell Biol. 2007;39:44–84. - PubMed

Publication types

MeSH terms