. 2012 May;221(2):297-315.
doi: 10.1007/s00213-011-2574-z. Epub 2011 Nov 24.

Evaluating genetic markers and neurobiochemical analytes for fluoxetine response using a panel of mouse inbred strains

Affiliations

Evaluating genetic markers and neurobiochemical analytes for fluoxetine response using a panel of mouse inbred strains

Cristina S Benton et al. Psychopharmacology (Berl). 2012 May.

Abstract

Rationale: Identification of biomarkers that establish diagnosis or treatment response is critical to the advancement of research and management of patients with depression.

Objective: Our goal was to identify biomarkers that can potentially assess fluoxetine response and risk to poor treatment outcome.

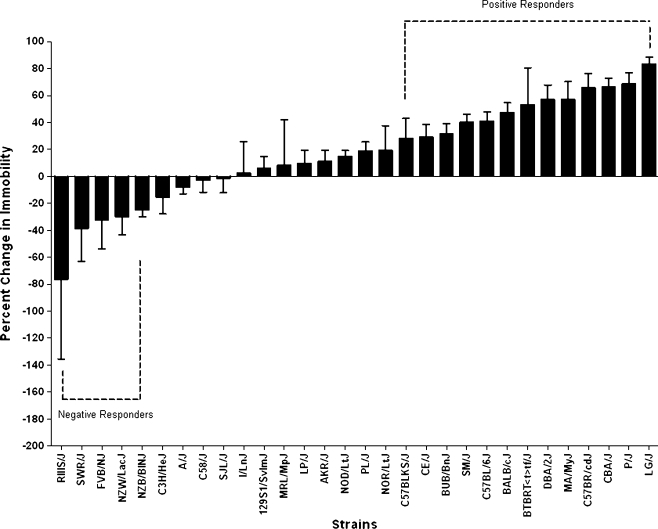
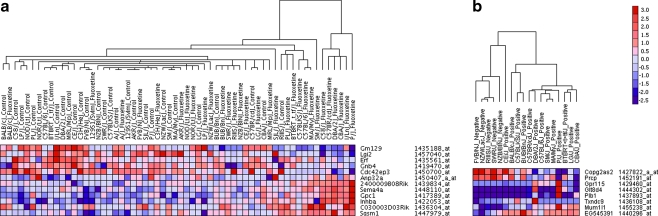
Methods: We measured behavior, gene expression, and the levels of 36 neurobiochemical analytes across a panel of genetically diverse mouse inbred lines after chronic treatment with water or fluoxetine.

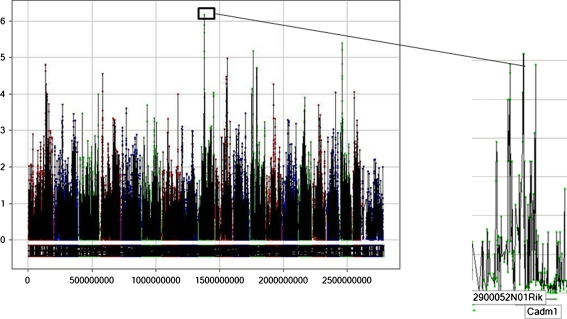
Results: Glyoxylase 1 (GLO1) and guanine nucleotide-binding protein 1 (GNB1) mostly account for baseline anxiety-like and depressive-like behavior, indicating a common biological link between depression and anxiety. Fluoxetine-induced biochemical alterations discriminated positive responders, while baseline neurobiochemical differences differentiated negative responders (p < 0.006). Results show that glial fibrillary acidic protein, S100 beta protein, GLO1, and histone deacetylase 5 contributed most to fluoxetine response. These proteins are linked within a cellular growth/proliferation pathway, suggesting the involvement of cellular genesis in fluoxetine response. Furthermore, a candidate genetic locus that associates with baseline depressive-like behavior contains a gene that encodes for cellular proliferation/adhesion molecule (Cadm1), supporting a genetic basis for the role of neuro/gliogenesis in depression.

Conclusion: We provided a comprehensive analysis of behavioral, neurobiochemical, and transcriptome data across 30 mouse inbred strains that has not been accomplished before. We identified biomarkers that influence fluoxetine response, which, altogether, implicate the importance of cellular genesis in fluoxetine treatment. More broadly, this approach can be used to assess a wide range of drug response phenotypes that are challenging to address in human samples.


Figures

Fig. 1
Fig. 1
Inter-strain difference in fluoxetine response. Response to treatment was calculated by taking the ratio of fluoxetine behavioral scores to vehicle behavioral scores. Percent change in immobility was calculated by multiplying the ratio of fluoxetine immobility scores to vehicle immobility scores by 100 and then subtracting the product from 100. We defined positive and negative responders as having at least 20% decreased or increased in immobility scores, respectively. Immobility is a measure of “hopelessness” or depressive-like behavior in mice. Strains with positive response to fluoxetine exhibited significant reduction in depressive-like behavior, while negative responders had an increased in immobility
Fig. 2
Fig. 2
a Neurobiochemical markers that covary with fluoxetine response (top). PLS analysis show that levels of GNB1, GLO1, S100β, GAD67, GFAP, and galanin covary most with response to open field and tail suspension tests (white bars). Levels of GFAP, S100β, GLO1, HDAC5, GAD67, P2X7, and GSK3β covary most with depressive-like response following chronic fluoxetine treatment (black bars). b Neurobiochemical analytes that contribute most to discriminating positive and negative responders (bottom). DWD analysis shows that S100β, GSK3β, HDAC5, and GNB1 discriminate positive responses (black bars) or negative response (white bars). The opposing direction of the S100β and GNB1 vectors indicates that both markers can discriminate negative and positive response groups from each other. Neurobiochemical differences induced by chronic fluoxetine treatment discriminate positive responders, while baseline neurobiological differences discriminate negative responders. Overall, neurobiochemical difference is observed when we defined positive response as a 20% (p < 0.006), 30% (p < 0.014), or a 40% (p < 0.026) reduction in immobility or when we defined negative response as a 20% (p < 0.006), 30% (p < 0.036), or a 40% (p < 0.016) increase in immobility. Data are shown when response is defined as 20% decreased or increased in immobility scores
Fig. 3
Fig. 3
a Hierarchical clustering of genes discriminating treatment from control (left). Gene expression patterns of the 12 most informative genes on each treatment group. b Hierarchical clustering of genes discriminating positive and negative response to fluoxetine treatment (right). Gene expression profiles of the eight most informative genes on each response group. Only strains deemed to have a response to treatment are shown. In both figures, color denotes the direction of gene expression changes (red, up-regulated; blue, down-regulated). Intensity illustrates the magnitude of change in gene expression
Fig. 4
Fig. 4
Genome-wide association plot for depressive-like behavior. Genomic region on Chr. 9 significantly correlates with depressive-like behavior (−logP = 6.17) and baseline levels of VEGF (−logP = 5.56) and CREB (−logP = 4.46). The figure shows baseline behavioral despair QTL. To the right are the putative genes underneath behavioral locus on Chr 9. The y-axis denotes the strength of association between genotype and phenotype (−logP scores), and the x-axis illustrates the cumulative SNP position on the genome

Similar articles

Cited by

References

    1. Amsterdam JD, Fawcett J, Quitkin FM, Reimherr FW, Rosenbaum JF, Michelson D, Hornig-Rohan M, Beasley CM. Fluoxetine and norfluoxetine plasma concentrations in major depression: a multicenter study. Am J Psychiatry. 1997;154:963–969. - PubMed
    1. Anderson L, Seilhamer J. A comparison of selected mRNA and protein abundances in human liver. Electrophoresis. 1997;18:533–537. doi: 10.1002/elps.1150180333. - DOI - PubMed
    1. Andreescu C, Lenze EJ, Dew MA, Begley AE, Mulsant BH, Dombrovski AY, Pollock BG, Stack J, Miller MD, Reynolds CF. Effect of comorbid anxiety on treatment response and relapse risk in late-life depression: Controlled study. Br J Psychiatry. 2007;190:344–349. doi: 10.1192/bjp.bp.106.027169. - DOI - PubMed
    1. Arai M, Yuzawa H, Nohara I, Ohnishi T, Obata N, Iwayama Y, Haga S, Toyota T, Ujike H, Ichikawa T, Nishida A, Tanaka Y, Furukawa A, Aikawa Y, Kuroda O, Niizato K, Izawa R, Nakamura K, Mori N, Matsuzawa D, Hashimoto K, Iyo M, Sora I, Matsushita M, Okazaki Y, Yoshikawa T, Miyata T, Itokawa M. Enhanced carbonyl stress in a subpopulation of schizophrenia. Arch Gen Psychiatry. 2010;67:589–597. doi: 10.1001/archgenpsychiatry.2010.62. - DOI - PubMed
    1. Baudry A, Mouillet-Richard S, Schneider B, Launay JM, Kellermann O. miR-16 targets the serotonin transporter: a new facet for adaptive responses to antidepressants. Science. 2010;329:1537–1541. doi: 10.1126/science.1193692. - DOI - PubMed

Publication types