

The chromosome 2p21 region harbors a complex genetic architecture for association with risk for renal cell carcinoma
- PMID: 22113997
- PMCID: PMC3277315
- DOI: 10.1093/hmg/ddr551
The chromosome 2p21 region harbors a complex genetic architecture for association with risk for renal cell carcinoma
Abstract
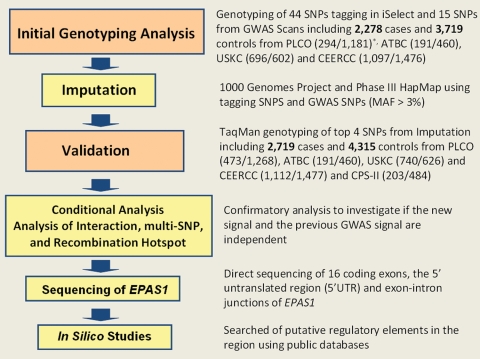
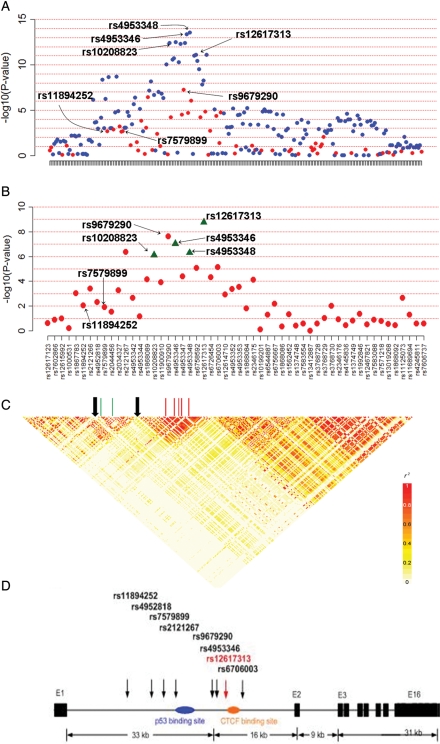
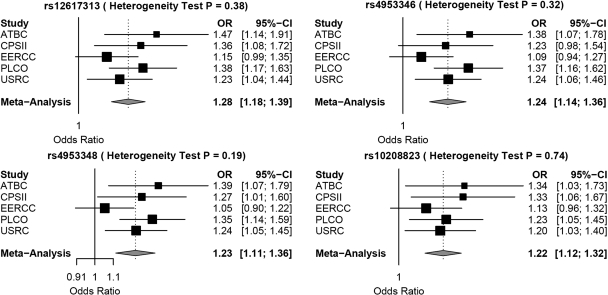
In follow-up of a recent genome-wide association study (GWAS) that identified a locus in chromosome 2p21 associated with risk for renal cell carcinoma (RCC), we conducted a fine mapping analysis of a 120 kb region that includes EPAS1. We genotyped 59 tagged common single-nucleotide polymorphisms (SNPs) in 2278 RCC and 3719 controls of European background and observed a novel signal for rs9679290 [P = 5.75 × 10(-8), per-allele odds ratio (OR) = 1.27, 95% confidence interval (CI): 1.17-1.39]. Imputation of common SNPs surrounding rs9679290 using HapMap 3 and 1000 Genomes data yielded two additional signals, rs4953346 (P = 4.09 × 10(-14)) and rs12617313 (P = 7.48 × 10(-12)), both highly correlated with rs9679290 (r(2) > 0.95), but interestingly not correlated with the two SNPs reported in the GWAS: rs11894252 and rs7579899 (r(2) < 0.1 with rs9679290). Genotype analysis of rs12617313 confirmed an association with RCC risk (P = 1.72 × 10(-9), per-allele OR = 1.28, 95% CI: 1.18-1.39) In conclusion, we report that chromosome 2p21 harbors a complex genetic architecture for common RCC risk variants.
Figures
References
-
- Jemal A., Siegel R., Ward E., Hao Y., Xu J., Thun M.J. Cancer statistics, 2009. CA Cancer J. Clin. 2009;59:225–249. doi:10.3322/caac.20006. - DOI - PubMed
-
- Chow W.H., Dong L.M., Devesa S.S. Epidemiology and risk factors for kidney cancer. Nat. Rev. Urol. 2010;7:245–257. doi:10.1038/nrurol.2010.46. - DOI - PMC - PubMed
-
- Ljungberg B., Cowan N.C., Hanbury D.C., Hora M., Kuczyk M.A., Merseburger A.S., Patard J.J., Mulders P.F.A., Sinescu I.C. EAU Guidelines on Renal Cell Carcinoma: the 2010 update. Eur. Urol. 2010;58:398–406. doi:10.1016/j.eururo.2010.06.032. - DOI - PubMed
-
- Yu M.C., Mack T.M., Hanisch R., Cicioni C., Henderson B.E. Cigarette smoking, obesity, diuretic use, and coffee consumption as risk factors for renal cell carcinoma. J. Natl Cancer Inst. 1986;77:351–356. - PubMed
-
- Chow W.H., Gridley G., Fraumeni J.F., Järvholm B. Obesity, hypertension, and the risk of kidney cancer in men. N. Engl. J. Med. 2000;343:1305–1311. doi:10.1056/NEJM200011023431804. - DOI - PubMed
Publication types
MeSH terms
Substances
Grants and funding
LinkOut - more resources
Full Text Sources
Medical
