. 2012 Feb;22(2):469-81.
doi: 10.1093/cercor/bhr301. Epub 2011 Nov 23.

Abundant occurrence of basal radial glia in the subventricular zone of embryonic neocortex of a lissencephalic primate, the common marmoset Callithrix jacchus

Affiliations

Abundant occurrence of basal radial glia in the subventricular zone of embryonic neocortex of a lissencephalic primate, the common marmoset Callithrix jacchus

Iva Kelava et al. Cereb Cortex. 2012 Feb.

Abstract

Subventricular zone (SVZ) progenitors are a hallmark of the developing neocortex. Recent studies described a novel type of SVZ progenitor that retains a basal process at mitosis, sustains expression of radial glial markers, and is capable of self-renewal. These progenitors, referred to here as basal radial glia (bRG), occur at high relative abundance in the SVZ of gyrencephalic primates (human) and nonprimates (ferret) but not lissencephalic rodents (mouse). Here, we analyzed the occurrence of bRG cells in the embryonic neocortex of the common marmoset Callithrix jacchus, a near-lissencephalic primate. bRG cells, expressing Pax6, Sox2 (but not Tbr2), glutamate aspartate transporter, and glial fibrillary acidic protein and retaining a basal process at mitosis, occur at similar relative abundance in the marmoset SVZ as in human and ferret. The proportion of progenitors in M-phase was lower in embryonic marmoset than developing ferret neocortex, raising the possibility of a longer cell cycle. Fitting the gyrification indices of 26 anthropoid species to an evolutionary model suggested that the marmoset evolved from a gyrencephalic ancestor. Our results suggest that a high relative abundance of bRG cells may be necessary, but is not sufficient, for gyrencephaly and that the marmoset's lissencephaly evolved secondarily by changing progenitor parameters other than progenitor type.


Figures
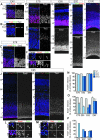
Figure 1.
Figure 1.
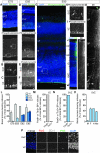
Distribution of Pax6-, Sox2-, and Tbr2-expressing progenitor cells in the VZ, SVZ, ISVZ, and OSVZ of marmoset neocortex at various embryonic stages. (A,B) E40, 10-μm cryosections. (A) Immunofluorescence for Pax6 (red/white). (B) Double immunofluorescence for Tbr2 (red/white) and phosphohistone H3 (PH3, green). (CF) E78, 12-μm cryosections. Double immunofluorescence for Sox2 (red/white) and PH3 (green) (C), Pax6 (red/white) and PH3 (green) (D), and Tbr2 (red/white) and PH3 (green) (E). (F) Double immunofluorescence for Sox2 (red/white) and PH3 (green/white), showing selected mitotic progenitor cells (arrowheads) in the SVZ (top row) and VZ (bottom row) at higher magnification. (G) E85, 5-μm paraffin section. Immunofluorescence for Sox2 (red/white). (H) E92, 12-μm cryosection. Double immunofluorescence for Pax6 (red/white) and PH3 (green). (I) E100, 50-μm cryotome section. Immunofluorescence for Tbr2 (red/white). (JM) E95, 20-μm cryosections. Double immunofluorescence for either Pax6 (red/white) (J,L) or Tbr2 (red/white) (K,M) and PH3 (green). Panels L and M show selected mitotic progenitor cells (arrowheads) in the SVZ (top row) and VZ (bottom row) at higher magnification; note the Tbr2-negative mitotic AP (dashed line). (NP) Quantification of Pax6-positive (Pax6+) mitoses (N), Sox2-positive (Sox2+) mitoses (O), and Tbr2-positive (Tbr2+) mitoses (P) at E78, E85, E92, and E95 as indicated, each expressed as a percentage of total mitoses in the VZ (gray), SVZ (light blue), ISVZ (medium blue), and OSVZ (dark blue). Numbers of quantified cells (marker/total) were as follows: Pax6: E78 (2 brains) VZ 314/327, SVZ 45/48; E92 (1 brain) VZ 88/91, ISVZ 22/29, OSVZ 66/85; E95 (2 brains) VZ 65/66, ISVZ 53/55, OSVZ 101/105. Sox2: E78 (2 brains) VZ 200/201, SVZ 21/37; E85 (3 brains) VZ 356/375, SVZ 45/109; E92 (1 brain) VZ 55/61, ISVZ 6/17, OSVZ 26/49; E95 (2 brains) VZ 38/40, ISVZ 18/24, OSVZ 72/108. Tbr2: E78 (2 brains) VZ 8/393, SVZ 52/63; E92 (1 brain) VZ 1/106, ISVZ 23/48, OSVZ 54/147; E95 (2 brains) VZ 11/83, ISVZ 28/57, OSVZ 79/185. E85 Sox2: data are the mean of 3 brains, bars indicate standard error of the mean. E78, E95 Pax6, Sox2, and Tbr2: data are the mean of 2 brains, bars indicate the variation of the individual values from the mean. All sections were counterstained with DAPI (blue). Cortical plate (CP), SP, IZ, SVZ, OSVZ (O), ISVZ (I) and VZ are indicated. All panels except G and I are single optical sections: (AF,L,M) 1.2 μm, (H,J,K) 2.4 μm. Scale bars: 5 μm (F,L,M), 20 μm (AE,H), and 100 μm (G,I,J,K).
Figure 2.
Figure 2.
Expression of cytoplasmic markers of RG cells in SVZ progenitor cells of marmoset neocortex at various embryonic stages. (AC) E78, 12-μm cryosection. Double immunofluorescence for phosphohistone H3 (PH3, green/white) and GLAST (red/white). Boxes in A indicate areas of the VZ and SVZ shown at higher magnification in B and C, respectively. Asterisk in C indicates a GLAST-expressing SVZ cell. (DF) E95, 20-μm cryosections. Triple immunofluorescence for GLAST (red/white), PH3 (green/white), and GFAP (white). Arrowheads and dashed lines indicate cell bodies of mitotic cells at the ventricular surface (E) and in the OSVZ (F). All sections were counterstained with DAPI (blue/white). Cortical plate (CP), SP, IZ, SVZ, OSVZ (O), ISVZ (I), and VZ are indicated. All images are single optical sections: (AC) 1.2 μm, (D) 2.4 μm, and (E,F) 0.9 μm. Scale bars: 10 μm (B,C,E,F), 20 μm (A), and 100 μm (D).
Figure 3.
Figure 3.
Occurrence of basal process–retaining progenitor cells in the SVZ of marmoset neocortex at various embryonic stages. (AC) E78, 50-μm vibratome section. Immunofluorescence for phosphovimentin (Ph-vim, green/white). Boxes in A (lower panel) indicate areas of SVZ and VZ shown at higher magnification in B and C, respectively. Images are maximum intensity projection of 40 1.2 μm–thick single optical sections. Solid arrowhead, basal process–bearing mitotic progenitor cell in SVZ; open arrowhead, mitotic progenitor cell in SVZ lacking a basal process. Note basal processes emanating from mitotic APs in C. (DF) E85, 60-μm vibratome section. Immunofluorescence for phosphovimentin (Ph-vim, green/white). Boxes in D (lower panel) indicate areas of SVZ and VZ shown at higher magnification in E and F, respectively. Images were obtained by conventional fluorescence microscopy. Solid arrowhead, basal process–bearing mitotic progenitor cell in SVZ. Note basal processes emanating from mitotic APs in F. (GI) E95, 100-μm vibratome section. Immunofluorescence for phosphovimentin (green/white). Boxes in G indicate areas of SVZ and VZ shown at higher magnification in H and I, respectively. Images are maximum intensity projection of 21 2.4 μm–thick single optical sections. Solid arrowhead, basal process–bearing mitotic progenitor cell in SVZ; open arrowhead, mitotic progenitor cell in SVZ lacking a basal process. Note basal processes emanating from mitotic APs in I. (J,K) E95, 100-μm vibratome section. DiI labeling (green/white) from pial side (green arrowhead). Dashed box in J (right panel) indicates the area of the cortical wall shown at higher magnification in K. Note the cell body (solid arrowhead) in the SVZ extending a basal process (open arrowheads) to the pial surface. Images are maximum intensity projection of 26 2.4 μm–thick single optical sections. (A,D,G,J) All sections were counterstained with DAPI (blue). Cortical plate (CP), SP, IZ, SVZ, and VZ are indicated. (L) Quantification, after phosphovimentin immunostaining, of basal process–bearing mitotic cells in the VZ (gray), SVZ (light blue), ISVZ (medium blue), and OSVZ (dark blue) at E78, E85, E92, and E95. Basal process–bearing mitoses are expressed as a percentage of total mitoses in the respective layer. Numbers of quantified cells (basal process bearing/total) were as follows: E78 (2 brains) VZ 164/446, SVZ 1/51; E85 (3 brains) VZ 380/598, SVZ 7/49; E92 (1 brain) VZ 83/148, ISVZ 7/30, OSVZ 36/141; E95 (2 brains) VZ 175/303, ISVZ 76/229, OSVZ 242/633. E85: data are the mean of 3 brains, bars indicate standard error of the mean (SEM); E78, E95: data are the mean of 2 brains, bars indicate the variation of the individual values from the mean. (M,N) Quantification of Pax6 (left bars) and Tbr2 (right bars) expression in phosphovimentin-immunostained basal process–bearing cells in the E95 VZ (gray, M) and SVZ (light blue, N). Data are from one brain. Numbers of quantified cells (Pax6+ or Tbr2+ basal process–bearing (BP+) mitoses/total BP+ mitoses) were as follows: Pax6 VZ 91/91, SVZ 48/49; Tbr2 VZ 1/38, 0/36. (O) Comparison of the relative abundance of basal process–bearing mitotic cells in the SVZ of E13.5 mouse, E39 ferret, 13wpc human, and E95 marmoset. Basal process–bearing mitoses are expressed as a percentage of total mitoses. Numbers of quantified cells (basal process bearing/total) were as follows: mouse E13.5 (4 brains) 17/431, ferret E39 (1 brain) 49/104, and marmoset E95 (2 brains) 318/862. Mouse E13.5 (M): data are the mean of 4 brains, bars indicate SEM; ferret E39 (F): data are the mean of 3 sections from one brain, bars indicate SEM; marmoset E95 (Ma): data are the mean of 2 brains, bars indicate the variation of the individual values from the mean. Data for human 13wpc (H) were taken from Figure 3d of Fietz et al. (2010). (P) E95, 20-μm cryosection. Triple immunofluorescence for Par3 (red/white), ZO-1 (white), and phosphohistone H3 (PH3, green/white), combined with DAPI staining (blue/white). Upper row, SVZ; lower row, VZ. Note the concentration of markers of apical polarity at the apical surface. Images are 1.2 μm–thick single optical sections. Scale bars: 5 μm (B,C,E,F,H,I), 10 μm (P), 20 μm (A,D,K), 50 μm (J), and 100 μm (G).
Figure 4.
Figure 4.
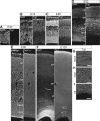
Cytoarchitecture of marmoset neocortex at various embryonic stages. Immunofluorescence for βIII-tubulin (Tuj1, right panels) combined with DAPI staining (left panels) at E40 (A, 10-μm cryosection), E78 (B, 12-μm cryosection), E85 (C, 5-μm paraffin section), E92 (D, 12-μm cryosection), E95 (E, 20-μm cryosection), and E100 (FI, 50-μm cryotome section). Boxes in F (right panel) indicate areas of OSVZ, ISVZ, and VZ shown at higher magnification in G, H, and I, respectively. Cortical plate (CP), SP, IZ, SVZ, OSVZ, ISVZ, and VZ are indicated. Images are 1.2 μm–thick single optical sections (A,B,D) or are conventional fluorescence microscopy images (C,EI). Scale bars: 10 μm (A), 20 μm (B,C), 50 μm (D,GI), and 100 μm (E,F).
Figure 5.
Figure 5.
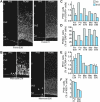
Comparison of cycling cells and cells in M-phase in embryonic marmoset and embryonic/postnatal ferret neocortex. (A,B) Double immunofluorescence for phosphohistone H3 (PH3) and PCNA of (A) E39 (left, 12-μm cryosection) and P1 (right, 20-μm cryosection) ferret neocortex and (B) E78 (left, 12-μm cryosection) and E95 (right, 20-μm cryosection) marmoset neocortex. All sections were counterstained with DAPI for quantification (data not shown). Cortical plate (CP), IZ, SVZ, and VZ, as well as ventricular surface (dashed lines), are indicated on PH3 images. Except for marmoset E78, the top margin of the images corresponds to the boundary between IZ and SP/CP. Arrowheads in B indicate PH3-positive cells. All images are 1.2 μm– (B, left) or 2.4 μm–thick (A,B, right) single optical sections. Scale bars: 20 μm (B, left), 50 μm (A), and 100 μm (B, right). (CF) Quantification of cycling and mitotic cells in the VZ (gray) and SVZ (blue) of E39 (2 brains) and P1 (1 brain) ferret (Fer) and E78 (1 brain), E92 (1 brain), and E95 (CE, 2 brains; F, 1 brain) marmoset (Mar) neocortex. (C) Quantification of PH3-positive (PH3+) cells, expressed as percentage of DAPI-stained (DAPI+) cells. Numbers of quantified cells (PH3+/DAPI+) were as follows: Ferret E39 VZ 17/1392, SVZ 14/2850; ferret P1 VZ 19/1140, SVZ 16/2374; marmoset E78 VZ 58/5050, SVZ 14/2904; marmoset E92 VZ 31/3604, SVZ 38/5694; marmoset E95 VZ 21/3239, SVZ 35/11226. (D) Quantification of PCNA-positive (PCNA+) cells, expressed as percentage of DAPI-stained (DAPI+) cells. Numbers of quantified cells (PCNA+/DAPI+) were as follows: Ferret E39 VZ 1060/1392, SVZ 788/2850; ferret P1 VZ 1351/2335, SVZ 1877/6646; marmoset E78 VZ 4602/4915, SVZ 1190/2224; marmoset E92 VZ 3278/3604 SVZ 3377/5694; marmoset E95 VZ 2138/3239, SVZ 3903/11226. (E) Quantification of PH3-positive (PH3+) cells, expressed as percentage of PCNA-positive (PCNA+) cells. Numbers of quantified cells (PH3+/PCNA+) were as follows: Ferret E39 VZ 17/1060, SVZ 14/788; ferret P1 VZ 19/785, SVZ 16/739; marmoset E78 VZ 58/4602, SVZ 10/1190; marmoset E92 VZ 31/3278 SVZ 38/3377; marmoset E95 VZ 21/2138, SVZ 35/3903. (F) Quantification of PH3-positive (PH3+) cells, expressed as percentage of Ki67-positive (Ki67+) cells. Numbers of quantified cells (PH3+/Ki67+) were as follows: Ferret P1 VZ 18/487, SVZ 23/655; marmoset E95 VZ 6/318, SVZ 13/868. E39 ferret and E95 marmoset (CE): data are the mean of 2 brains, bars indicate the variation of the individual values from the mean.
Figure 6.
Figure 6.
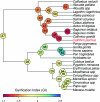
GI estimates for the ancestors of 26 anthropoid species. Ancestral GI values are indicated by colored circles at the root and internal nodes of the phylogeny (see color scale at bottom). For details, see Materials and Methods. Numbers in colored circles refer to node numbers (for the GI values associated with these nodes, see Supplementary Table 2), and branches are drawn proportional to time. The marmoset species analyzed in this study (Callithrix jacchus) is highlighted in red.
Figure 7.
Figure 7.
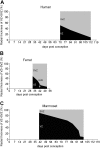
Radial thickness ratio of SVZ/VZ during embryonic development of human, ferret, and marmoset neocortex. Radial thickness of the VZ and SVZ was measured using the images shown in Figure 1dk (human, A) and Figure 1ns (ferret, B) of Fietz et al. (2010) and Figure 4AF (marmoset, C). At each developmental stage, radial thickness values of the VZ (black areas) and SVZ (gray areas) are expressed as percentage of the sum of VZ + SVZ.

Comment in

References

    1. Abdel-Mannan O, Cheung AF, Molnar Z. Evolution of cortical neurogenesis. Brain Res Bull. 2008;75:398–404. - PubMed
    1. Arai Y, Pulvers JN, Haffner C, Schilling B, Nusslein I, Calegari F, Huttner WB. Neural stem and progenitor cells shorten S-phase on commitment to neuron production. Nat Commun. 2011;2:154. - PMC - PubMed
    1. Bunk EC, Stelzer S, Hermann S, Schafers M, Schlatt S, Schwamborn JC. Cellular organization of adult neurogenesis in the common marmoset. Aging Cell. 2011;10:28–38. - PubMed
    1. Cheung AF, Kondo S, Abdel-Mannan O, Chodroff RA, Sirey TM, Bluy LE, Webber N, DeProto J, Karlen SJ, Krubitzer L, et al. The subventricular zone is the developmental milestone of a 6-layered neocortex: comparisons in metatherian and eutherian mammals. Cereb Cortex. 2010;20:1071–1081. - PubMed
    1. Dehay C, Kennedy H. Cell-cycle control and cortical development. Nat Rev Neurosci. 2007;8:438–450. - PubMed

Publication types

MeSH terms