Comparative Study
. 2011 Nov 23;31(47):17040-51.
doi: 10.1523/JNEUROSCI.2209-11.2011.

Dual γ rhythm generators control interlaminar synchrony in auditory cortex

Affiliations
Comparative Study

Dual γ rhythm generators control interlaminar synchrony in auditory cortex

Matthew Ainsworth et al. J Neurosci. .

Erratum in

  • J Neurosci. 2012 Feb 22;32(8):2911

Abstract

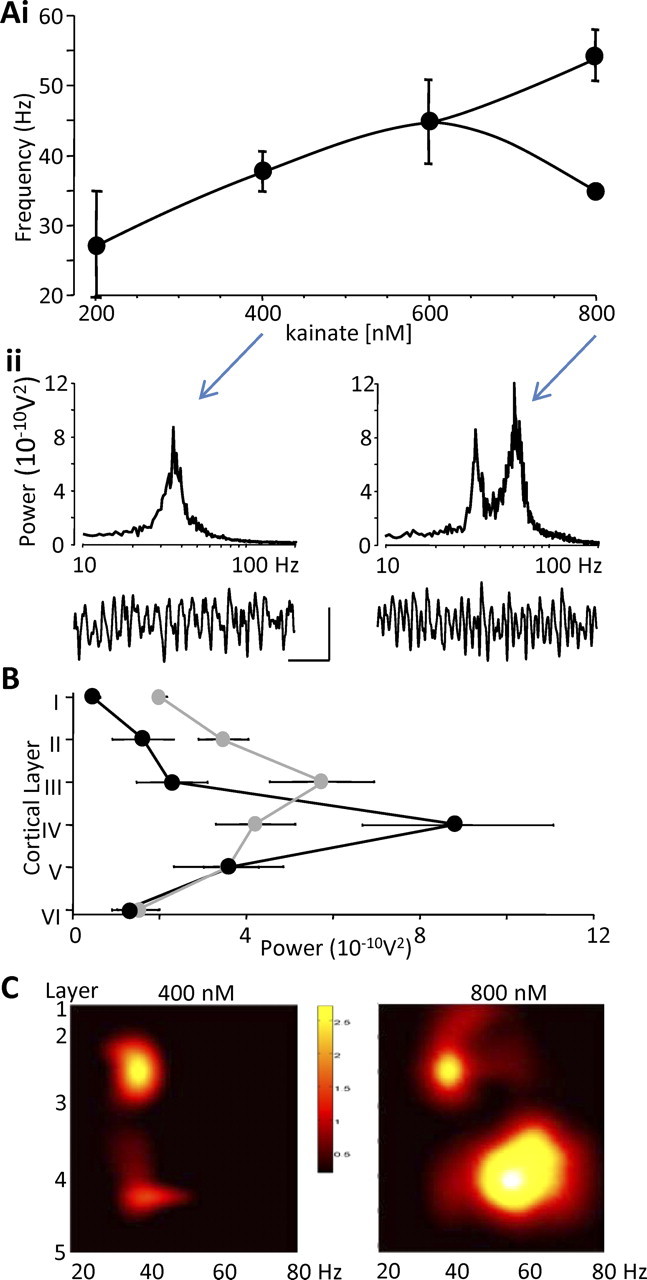
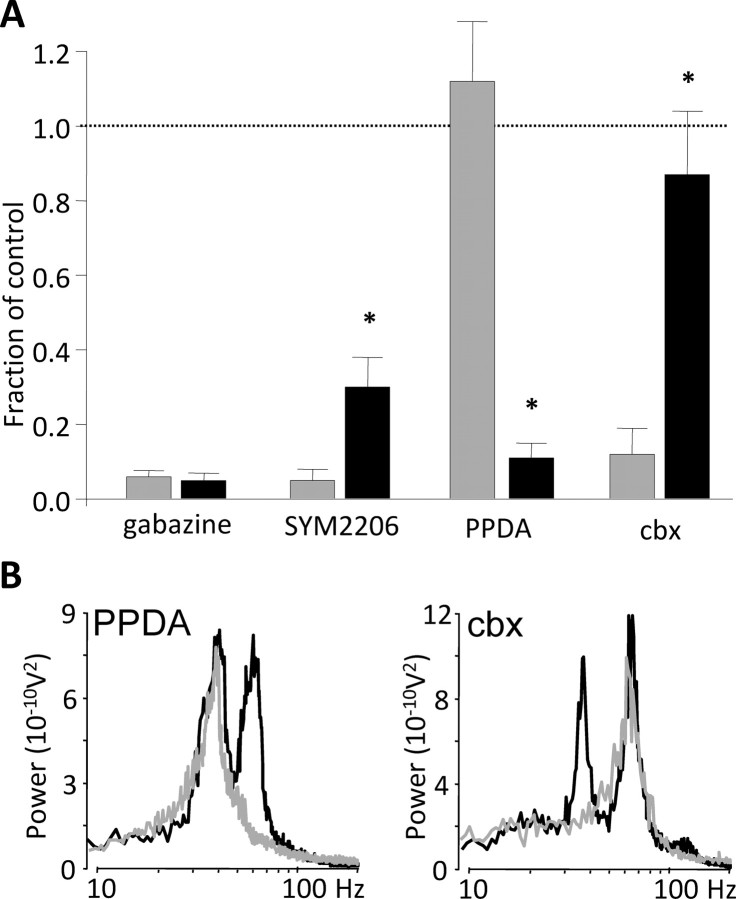
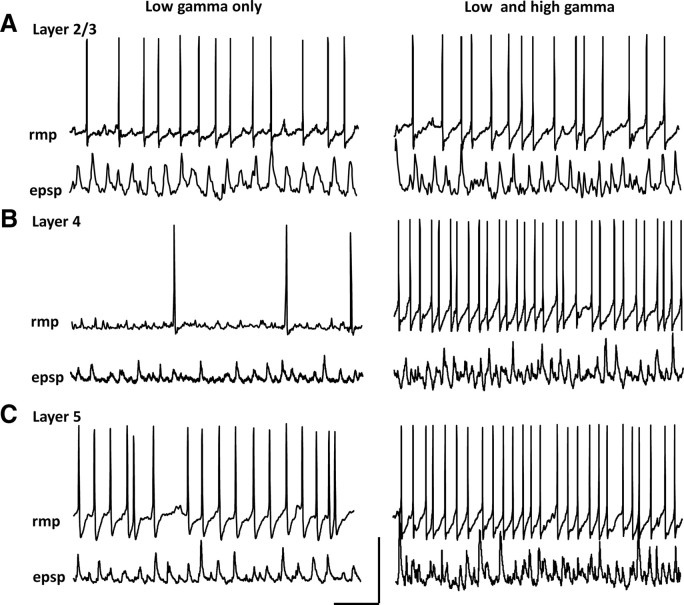
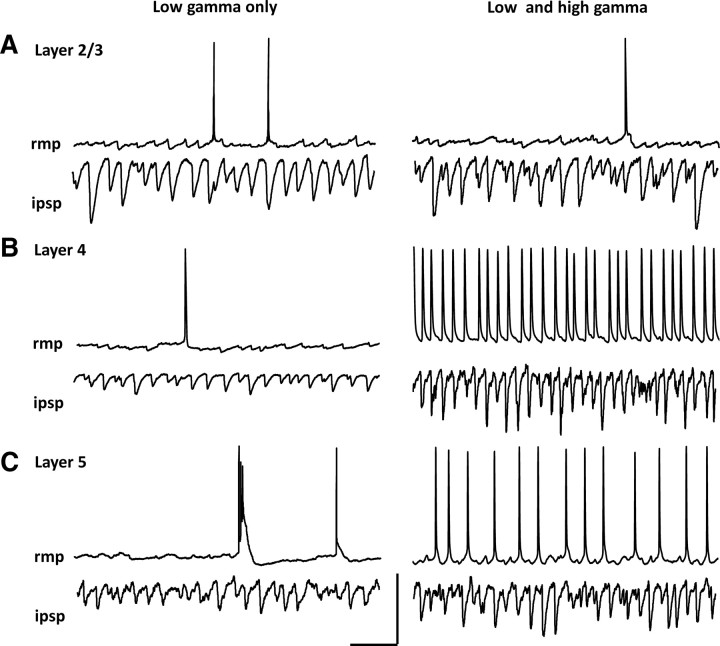
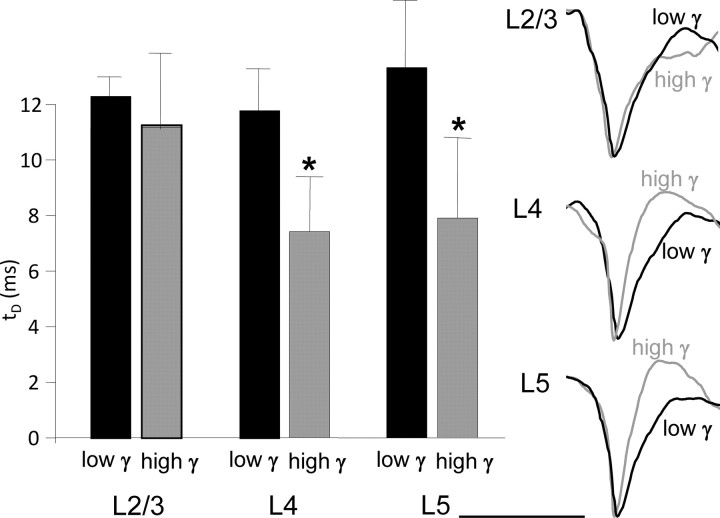
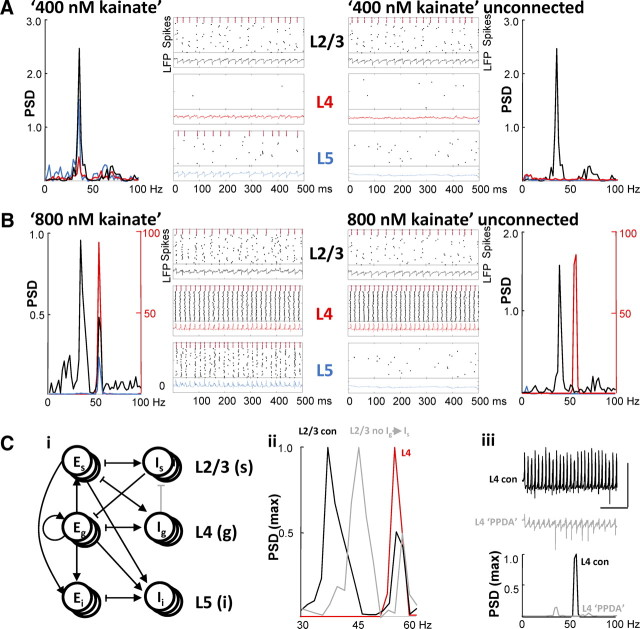
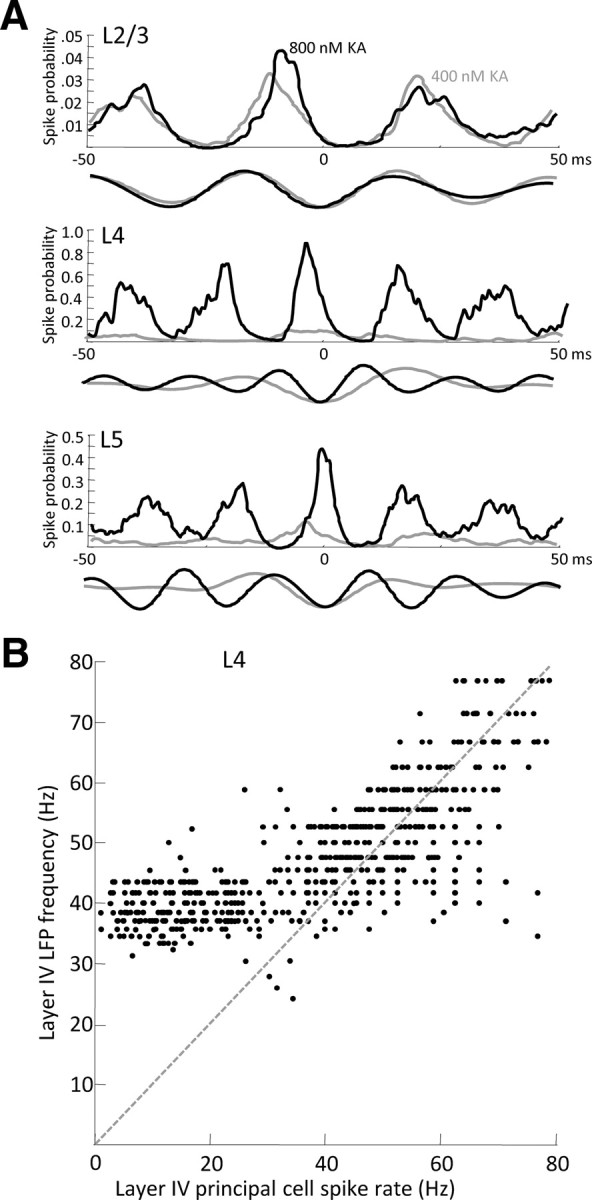
Rhythmic activity in populations of cortical neurons accompanies, and may underlie, many aspects of primary sensory processing and short-term memory. Activity in the gamma band (30 Hz up to >100 Hz) is associated with such cognitive tasks and is thought to provide a substrate for temporal coupling of spatially separate regions of the brain. However, such coupling requires close matching of frequencies in co-active areas, and because the nominal gamma band is so spectrally broad, it may not constitute a single underlying process. Here we show that, for inhibition-based gamma rhythms in vitro in rat neocortical slices, mechanistically distinct local circuit generators exist in different laminae of rat primary auditory cortex. A persistent, 30-45 Hz, gap-junction-dependent gamma rhythm dominates rhythmic activity in supragranular layers 2/3, whereas a tonic depolarization-dependent, 50-80 Hz, pyramidal/interneuron gamma rhythm is expressed in granular layer 4 with strong glutamatergic excitation. As a consequence, altering the degree of excitation of the auditory cortex causes bifurcation in the gamma frequency spectrum and can effectively switch temporal control of layer 5 from supragranular to granular layers. Computational modeling predicts the pattern of interlaminar connections may help to stabilize this bifurcation. The data suggest that different strategies are used by primary auditory cortex to represent weak and strong inputs, with principal cell firing rate becoming increasingly important as excitation strength increases.


Figures

Figure 1.
Figure 1.
Increasing excitation to A1 induced lamina-specific frequency bifurcation of population gamma rhythms. Ai, Mean modal peak gamma rhythm power in population recordings from layer 4. As gamma power increases from 200 to 600 nm, kainate frequency also increases. With kainate concentrations beyond 600 nm, dual modal peaks are seen in the power spectra. Data shown as mean ± SEM (n = 6 slices from 6 rats). Aii, Example pooled power spectra on either side of the bifurcation point (n = 6 slices from 6 rats) and corresponding single examples of population potentials below. Calibration: 200 μV, 100 ms. B, Laminar profile of peak gamma power in A1. Data shown as mean ± SEM (n = 6 slices from 6 rats) for gamma generated by 800 nm kainate at peak frequencies of 30–45 Hz (gray lines and symbols) and 50–80 Hz (black lines and symbols). C, Power spectral density [mean (n = 5 slices from 5 rats) plotted as color map, in decibels] versus lamina and frequency within A1 before (400 nm kainate) and after (800 nm kainate) frequency bifurcation. Data shown taken from 1 × 10 linear array electrodes. Similar data were also obtained using parallel shanks on Utah probes but with lower spatial resolution.
Figure 2.
Figure 2.
Pharmacological manipulation reveals different mechanisms underlying the slow and fast gamma rhythms. A, Proportional change in mean (n = 5 slices from 5 rats) gamma power for slow, layer 2/3 gamma (30–45 Hz, gray bars) and fast, layer 4 gamma (50–80 Hz, black bars), induced by 800 nm kainate. Both rhythms were equally sensitive to GABAA receptor blockade (gabazine, 1 μm). Layer 4, high gamma was significantly less sensitive to AMPA receptor blockade (SYM2206, 10 μm) and nonspecific gap junction conductance decrease [carbenoxolone (cbx), 0.2 mm[rsqb]. Layer 2/3, slow gamma was insensitive to NR2C/D-containing NMDAR blockade (PPDA, 10 μm), whereas this manipulation almost abolished layer 4, fast gamma. Asterisks indicate significantly different effects of each drug on the two gamma rhythms (p < 0.05, n = 5 slices from 5 rats). B, Example pooled power spectra (n = 5 slices from 5 rats) for layer 4 population responses to 800 nm kainate showing the differential effects of PPDA (left graph) and carbenoxolone (right graph).
Figure 3.
Figure 3.
Lamina-specific interneuron input/output behavior before and after frequency bifurcation. A, Example layer 2/3 FS interneuron recordings during exposure to 400 nm kainate (low gamma only) and 800 nm kainate (low and high gamma). Top traces show behavior at resting membrane potential (RMP) in each condition (−55 mV, low gamma only; −53 mV, low and high gamma). Bottom traces show EPSP inputs recorded from −70 mV in each case. Note the maintenance of low gamma frequency spike generation despite the addition of faster, smaller EPSPs in the low and high gamma condition. B, Example recordings from a layer 4 FS interneuron during 400 and 800 nm kainate application, RMPs of −57 and −52 mV, respectively. Bottom traces show EPSP inputs at −70 mV. Note the paucity of spike generation and EPSP inputs in the low gamma condition is transformed into spiking at high gamma frequencies, with high gamma frequency EPSP inputs in 800 nm kainate. C, Example recordings from layer 5 FS interneurons in the two conditions. RMPs were −56 and −54 mV. Note spike rates switch from low to high gamma frequency corresponding to an increase in rate of EPSPs from low to high gamma frequency. Calibration: 100 ms, 40 mV (RMP), 10 mV (EPSP).
Figure 4.
Figure 4.
Lamina-specific principal cell input/output behavior before and after frequency bifurcation. A, Example layer 2/3 regular spiking pyramidal cell recordings during exposure to 400 nm kainate (low gamma only) and 800 nm kainate (low and high gamma). Top traces show behavior at RMP in each condition (−63 mV, low gamma only; −66 mV, low and high gamma). Bottom traces show IPSP inputs recorded from −30 mV in each case. Note the maintenance of very sparse spike generation despite the addition of faster, smaller IPSPs in the low and high gamma condition. B, Example recordings from a layer 4 accommodating principal cell during 400 and 800 nm kainate application, with RMPs of −64 and −57 mV, respectively. Bottom traces show IPSP inputs at −70 mV. Note the paucity of spike generation accompanying low gamma frequency, relatively broad IPSPs in the low gamma condition is transformed into near 1:1 spiking on each period of the high gamma local field potential. Note also the marked increase in mean IPSP amplitude in 800 nm kainate. C, Example recordings from a layer 5 intrinsically bursting pyramidal cell in the two conditions. RMPs were −67 and −63 mV. Note that spike rates switch from sparse, with bursts, to a missed-beat pattern during 800 nm kainate. Note also the increase in rate of IPSPs in this cell type. Calibration: 100 ms, 30 mV (RMP), 8 mV (IPSP).
Figure 5.
Figure 5.
Higher gamma frequencies associate with faster pyramidal neuron IPSPs in layers 4 and 5 but not layer 2/3. Graph shows mean decay constants (single-exponential fit) for IPSPs (average of 50 IPSPs per principal cell subtype averaged over n = 5 cells from 5 slices in each case) recorded from principal cells in each layer held at −30 mV by depolarizing current injection. Black bars show data in the presence of 400 nm kainate (low-frequency gamma only). Gray bars show data in the presence of 800 nm kainate (low- and higher-frequency gamma rhythms coexpressed). *p < 0.05. Right shows example mean IPSPs from single neurons (IPSP amplitude maximum-referenced average of 50 events in each case). Black traces are taken in the presence of 400 nm kainate, gray traces in 800 nm. Calibration: 20 ms.
Figure 6.
Figure 6.
Computational model demonstrates laminar-specific frequency sensitivity with change in drive. A, Behavior of the model network in conditions mimicking low glutamatergic excitation (400 nm kainate). The model robustly reproduces the core features of the experimental data: a low-frequency gamma rhythm in layers 2/3 projected to layers 4 and 5; sparse spiking in principal cells; only interneuron recruitment in layers 2/3 and 5, abolished by uncoupling layers (right) (compare Figs. 3, 4). B, Elevated tonic drive to layer 4 principal cells generates a faster rhythm in the model granular layer accompanied by local, intense principal cell spiking. Note that the lower-frequency, layer 2/3 rhythm persists in the presence of this faster rhythm but at marginally lower power, but the layer 5 rhythm switches to the layer 4 input frequency. Each of these two effects is abolished with removal of interlaminar connections. Note the separate calibration bar (in red, right of PSD graphs) for power spectra from layer 4. Ci, Diagram showing the structure of the model (for details, see Materials and Methods). Cii, The frequency bifurcation is enhanced by interlaminar interactions. Model predicts the reduction in frequency seen at 800 nm kainate is in part generated by ascending inhibition onto superficial interneurons (Ig–Is removed, gray spectrum). Ciii, Model shows that effects of PPDA can be attributed to reduction in Eg–Eg recurrent excitation alone. Figure shows simulated field potentials from layer 4 in the presence (black) and absence (gray) of Eg–Eg with NMDAR-like kinetics. Calibration: 0.2 V, 100 ms. LFP, Local field potential.
Figure 7.
Figure 7.
Layers 4 and 5 but not layer 2/3 principal cells phase lock to the faster gamma rhythm. A, Graphs showing mean (n = 5 cells from 5 slices each from a separate rat) spike probability for layer 2/3 (top), layer 4 (middle), and layer 5 (bottom) principal cells. Data are plotted as probability of observing a spike on any given gamma period relative to local field potential phase in 1 ms bins, with 0 ms being the peak negativity in the field on each period. Data are overlaid from the two kainate (KA) concentrations: 400 nm generating only the lower gamma frequency (gray line) and 800 nm generating both fast and slow gamma rhythms concurrently (black line). Mean example traces below show 100 ms epochs of local field potential averaged to each spike in the corresponding intracellular recording. Note the different probability values on the axes for each of the three principal cell types. B, Period-by-period analysis of the relationship between instantaneous layer 4 local field potential frequency and corresponding layer 4 principal cell spiking. Data are pooled for both 400 and 800 nm kainate conditions. Note the near 1:1 relationship between layer 4 principal cell spike rate and field potential frequency for gamma frequencies over ∼45 Hz.
Figure 8.
Figure 8.
The generation of the higher gamma frequency rhythm in layer 4 switches interlaminar synchrony relative to the layer 5 local field potential. A, Plots of field potential cross-correlation values (as color map) against phase and layer. Reference in each case was mid-layer 5 electrode. Note the contrasting interlaminar interactions in the presence of a single low gamma rhythm (400 nm kainate, left) and high and low gamma rhythms (800 nm kainate, right). B, Plot of mean, maximal synchrony within a ±5-ms-wide bin centered around 0 ms from cross-correlations with layer 5 as reference. Note that layer 5 synchronizes preferentially with layer 2/3 in the low gamma condition (400 nm kainate, gray line) but layer 4 in the high and low gamma condition (800 nm kainate, black line).

References

    1. Atencio CA, Schreiner CE. Columnar connectivity and laminar processing in cat primary auditory cortex. PLoS One. 2010;5:e9521. - PMC - PubMed
    1. Binshtok AM, Fleidervish IA, Sprengel R, Gutnick MJ. NMDA receptors in layer 4 spiny stellate cells of the mouse barrel cortex contain the NR2C subunit. J Neurosci. 2006;26:708–715. - PMC - PubMed
    1. Börgers C, Epstein S, Kopell NJ. Background gamma rhythmicity and attention in cortical local circuits: a computational study. Proc Natl Acad Sci U S A. 2005;102:7002–7007. - PMC - PubMed
    1. Chalk M, Herrero JL, Gieselmann MA, Delicato LS, Gotthardt S, Thiele A. Attention reduces stimulus-driven gamma frequency oscillations and spike field coherence in V1. Neuron. 2010;66:114–125. - PMC - PubMed
    1. Compte A, Sanchez-Vives MV, McCormick DA, Wang XJ. Cellular and network mechanisms of slow oscillatory activity (<1 Hz) and wave propagations in a cortical network model. J Neurophysiol. 2003;89:2707–2725. - PubMed

Publication types