Comparative Study
. 2011 Nov 23;31(47):17306-16.
doi: 10.1523/JNEUROSCI.1915-11.2011.

Effect of auditory cortex deactivation on stimulus-specific adaptation in the medial geniculate body

Affiliations
Comparative Study

Effect of auditory cortex deactivation on stimulus-specific adaptation in the medial geniculate body

Flora M Antunes et al. J Neurosci. .

Abstract

An animal's survival may depend on detecting new events or objects in its environment, and it is likely that the brain has evolved specific mechanisms to detect such changes. In sensory systems, neurons often exhibit stimulus-specific adaptation (SSA) whereby they adapt to frequently occurring stimuli, but resume firing when "surprised" by rare or new ones. In the auditory system, SSA has been identified in the midbrain, thalamus, and auditory cortex (AC). It has been proposed that the SSA observed subcortically originates in the AC as a higher-order property that is transmitted to the subcortical nuclei via corticofugal pathways. Here we report that SSA in the auditory thalamus of the rat remains intact when the AC is deactivated by cooling, thus demonstrating that the AC is not necessary for the generation of SSA in the thalamus. The AC does, however, modulate the responses of thalamic neurons in a way that strongly indicates a gain modulation mechanism. The changes imposed by the AC in thalamic neurons depend on the level of SSA that they exhibit.


Figures

Figure 1.
Figure 1.
Stages of the AC deactivation cycle. a, Temperature changes recorded at the cooling loop and in MGB during a complete AC deactivation cycle. Temperatures decreased by ∼5°C in the MGB while the surface of the auditory cortex was cooled. Temperature in the MGB never fell below 26°C. b, c, Peristimulus time histograms show the activity of the units that Figure 2, a–l (b) and m–x (c), shows in the five stages of the cycle. Both units had a stronger response to the deviant than to the standard stimulus (i.e., showed SSA) in all conditions. Note the strong decrease in activity during the cool condition compared with the activity in the warm and recovery conditions, and the gradual changes during the transitional stages between conditions.
Figure 2.
Figure 2.
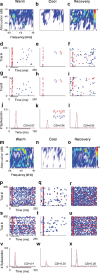
Examples of single-unit responses in the MGB before, during, and after AC deactivation. a–c, The FRA of a neuron localized to the MGM in the warm, cool, and recovery conditions. d–i, Responses of the neuron to the oddball paradigm as dot rasters, which plot individual spikes (red and blue dots, to the deviant and standard, respectively) in each of the three conditions, for the first block (f1/f2 as standard/deviant) (d–f) and second block (f2/f1 as standard/deviant) (g–i) of stimulus presentations (stacked along the y-axis: trial number, 400 trials per block). The time between trials (250 ms; x-axis) corresponds to the stimulus repetition rate (4 Hz; with 75 ms stimulus duration; black horizontal lines under the plots). j–l, Peristimulus time histograms (PSTHs) show the number of spikes/stimulus (bin duration: 3 ms) averaged over the two blocks [(f1 + f2)/2; blue line is standard, red line is deviant]. The CSI calculated for each condition is noted as an insert on the PSTHs. m–x, Responses of another neuron localized to the MGD, presented as in a–l.
Figure 3.
Figure 3.
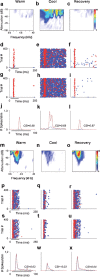
Examples of single-unit responses in the MGB before, during, and after AC deactivation. a–c, The FRAs in the three conditions of a neuron localized to the MGM that was facilitated during AC deactivation. d–i, Responses of the neuron to the oddball paradigm as dot rasters, which plot individual spikes (red and blue dots, to the deviant and standard, respectively) in each of the three conditions, for the first block (f1/f2 as standard/deviant) (d–f) and second block (f2/f1 as standard/deviant) (g–i) of stimulus presentations (stacked along the y-axis: trial number, 400 trials per block). The time between trials (250 ms; x-axis) corresponds to the stimulus repetition rate (4 Hz; with 75 ms stimulus duration, black horizontal lines under the plots). j–l, Peristimulus time histograms (PSTHs) show the number of spikes/stimulus (bin duration: 3 ms) averaged over the two blocks [(f1 + f2)/2; blue line is standard, red line is deviant]. The CSI calculated for each condition is noted as an insert on the PSTHs. m–x, Responses of another neuron localized to the MGV with a V-shaped-type FRA that did not show SSA (similar response to both stimuli: CSI, ∼0).
Figure 4.
Figure 4.
SSA quantification and its time course of adaptation in the MGB neurons before, during, and after AC deactivation. a, Box plots showing the distribution of CSI values in the warm (red), cool (blue), and recovery conditions (green), for the population of active neurons that responded to both frequencies during cooling (n = 37). The continuous and dashed horizontal lines across the plots represent the median and mean values, respectively. b, CSI values for each individual neuron in the warm (red dots), cool (blue dots), and recovery (green dots) conditions. Of the 48 neurons, only 37 had a CSI value for the cool condition. Error bars indicate SD, calculated using bootstrapping. Asterisks indicate neurons that had a significantly lower CSI value during the cool condition outside 2 SDs of the bootstrapped sample. c, d, Average population firing rate (spikes/stimulus) in response to the standard stimulus of the neurons with adaptation (CSI >0.18) (c) and without adaptation (CSI ≤0.18) (d) versus trial number, in the warm (red line), cool (blue line), and recovery (green line) conditions. e, Responses to the deviant stimulus for all neurons, presented as in c and d.
Figure 5.
Figure 5.
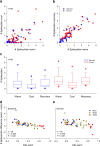
Effect of AC deactivation on the firing rate of MGB neurons. a, b, Scatterplots of the responses of all neurons (spikes/stimulus, n = 48) to the deviant (red dots) and standard stimulus (blue dots) in the warm versus cool condition (p < 0.001, both stimuli, Wilcoxon signed rank test) (a) and warm versus recovery condition (n.s., both stimuli, Wilcoxon signed rank test) (b). c, Box plots showing the distribution of firing rate values in the whole population (n = 48) in the warm, cool, and recovery conditions, in response to the standard (blue plots) and the deviant stimulus (red plots). d, e, Scatterplots of the CSI (warm condition) versus the difference in firing rate between the warm and cool conditions (spikes/stimulus difference) in response to the standard stimulus (d) and in response to the deviant stimulus (e), for each neuron. Blue, green, and red dots represent the neurons that were localized to the ventral (n = 12), dorsal (n = 24), and medial (n = 9) subdivisions of the MGB, respectively (n = 45). Positive values indicate a reduction in firing rate with AC deactivation, and negative values an increment (above and below the horizontal line at the origin, respectively).
Figure 6.
Figure 6.
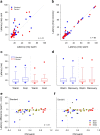
Effect of AC deactivation on the latency of MGB neurons. a, b, Scatterplots showing the mean first spike latencies (latency, in milliseconds) of the active neurons during cooling (n = 41) to the deviant (red dots) and standard stimuli (blue dots) in the warm versus cool condition (p < 0.001, both stimuli, Wilcoxon signed rank test) (a) and the latencies of all neurons (n = 48) in the warm versus recovery conditions (n.s., both stimuli, Wilcoxon signed rank test) (b). c, d, Box plots showing the distribution of latency values in response to the standard (blue plots) and the deviant stimuli (red plots) in the warm and cool conditions for the population of active neurons during cooling (n = 41) (c) and in the warm and recovery conditions for all neurons (n = 48) (d). e, f, Scatterplots of the CSI (warm condition) versus the difference in latency between the warm and cool conditions (latency difference) in response to the standard stimulus (e) and in response to the deviant stimulus (f), for each neuron. Blue, green, and red dots represent the neurons that were localized to the ventral (n = 12), dorsal, (n = 24) and medial (n = 9) subdivisions of the MGB, respectively (n = 45). Positive values indicate a decrease in latency with AC deactivation, and negative values an increase (above and bellow the horizontal line at the origin, respectively).

References

    1. Abbott LF, Varela JA, Sen K, Nelson SB. Synaptic depression and cortical gain control. Science. 1997;275:220–224. - PubMed
    1. Abolafia JM, Vergara R, Arnold MM, Reig R, Sanchez-Vives MV. Cortical auditory adaptation in the awake rat and the role of potassium currents. Cereb Cortex. 2011;21:977–990. - PubMed
    1. Antunes FM, Malmierca MS. Top-down modulation of stimulus-specific adaptation in the auditory thalamus. Abstracts of the 34th MidWinter Meeting of the Association for Research in Otolaryngology; Mt. Royal, NJ: Association for Research in Otolaryngology; 2011. pp. 93–94.
    1. Antunes FM, Nelken I, Covey E, Malmierca MS. Stimulus-specific adaptation in the auditory thalamus of the anesthetized rat. PLoS One. 2010;5:e14071. - PMC - PubMed
    1. Bajo VM, Rouiller EM, Welker E, Clarke S, Villa AE, de Ribaupierre Y, de Ribaupierre F. Morphology and spatial distribution of corticothalamic terminals originating from the cat auditory cortex. Hear Res. 1995;83:161–174. - PubMed

Publication types