Review
. 2011:76:235-46.
doi: 10.1101/sqb.2011.76.010694. Epub 2011 Nov 23.

Metabolomics in drug target discovery

Affiliations
Review

Metabolomics in drug target discovery

J D Rabinowitz et al. Cold Spring Harb Symp Quant Biol. 2011.

Abstract

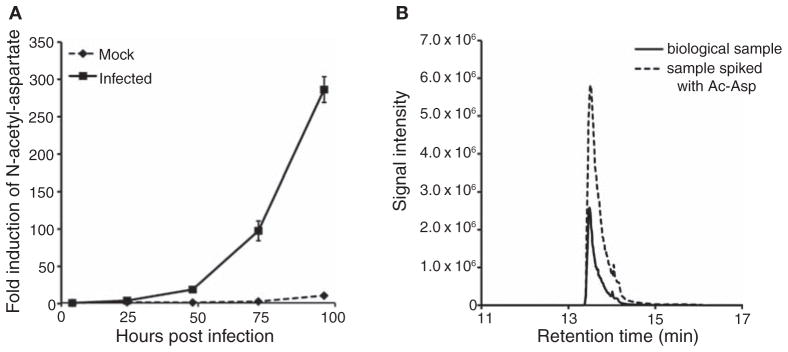
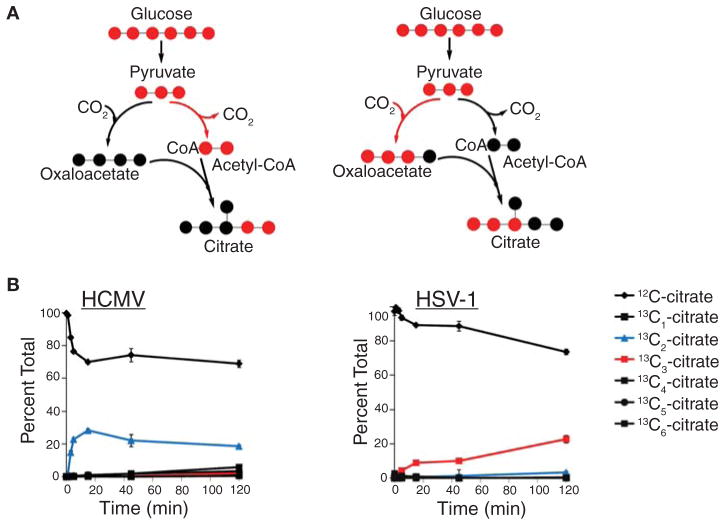
Most diseases result in metabolic changes. In many cases, these changes play a causative role in disease progression. By identifying pathological metabolic changes, metabolomics can point to potential new sites for therapeutic intervention. Particularly promising enzymatic targets are those that carry increased flux in the disease state. Definitive assessment of flux requires the use of isotope tracers. Here we present techniques for finding new drug targets using metabolomics and isotope tracers. The utility of these methods is exemplified in the study of three different viral pathogens. For influenza A and herpes simplex virus, metabolomic analysis of infected versus mock-infected cells revealed dramatic concentration changes around the current antiviral target enzymes. Similar analysis of human-cytomegalovirus-infected cells, however, found the greatest changes in a region of metabolism unrelated to the current antiviral target. Instead, it pointed to the tricarboxylic acid (TCA) cycle and its efflux to feed fatty acid biosynthesis as a potential preferred target. Isotope tracer studies revealed that cytomegalovirus greatly increases flux through the key fatty acid metabolic enzyme acetyl-coenzyme A carboxylase. Inhibition of this enzyme blocks human cytomegalovirus replication. Examples where metabolomics has contributed to identification of anticancer drug targets are also discussed. Eventual proof of the value of metabolomics as a drug target discovery strategy will be successful clinical development of therapeutics hitting these new targets.


Figures

Figure 1
Figure 1
Chemical structure of uracil and its anticancer analog, 5-fluorouracil.
Figure 2
Figure 2
Representative raw chromatograms produced by LC-MS-based metabolomics. A metabolite extract was analyzed by LC–high-resolution MS in negative ion mode on a stand-alone orbitrap instrument. Each compound is identified by both its retention time and exact mass. (Reprinted, with permission, from Lu et al. 2010; © American Chemical Society.)
Figure 3
Figure 3
Metabolome remodeling during viral infections points to antiviral drug targets. Quiescent human fibroblasts were mock-infected or infected with influenza A virus (IVA), herpes simplex virus-1 (HSV-1), or human cytomegalovirus (HCMV). Relative metabolite levels in the infected and mock-infected cells were measured by LC-MS or a stand-alone orbitrap instrument and LC-MS/MS on a triple quadrupole instrument (QQQ). The resulting log-transformed fold changes in metabolite concentrations are shown in heat map format. LC-MS/MS measurements are designated by “QQQ” after the compound name. Each virus institutes a different metabolic program: IVA strongly increases acetylneuraminic acid, HSV-1 increases deoxypyrimidines, and HCMV increases metabolites of the TCA cycle and acetylated amino acids. The strongest metabolome changes induced by IVA and HSV-1 point to the preferred enzyme targets for treating these viruses; the changes induced by HCMV point to a new therapeutic opportunity. (Parts of this figure are adapted from Vastag et al. 2011.)
Figure 4
Figure 4
N-Acetyl-aspartate is the most strongly up-regulated metabolite in HCMV infection. (A) Time course of N-acetyl-aspartate accumulation. (B) Chromatogram showing overlapping LC-MS signal for biological sample and N-acetyl-aspartate standard.
Figure 5
Figure 5
HCMV and HSV-1 induce divergent modes of TCA cycle activity. Infected fibroblasts were switched into media containing uniformly 13C-labeled glucose at t = 0 and citrate labeling was measured by LC-MS. (A) HCMV induces rapid formation of doubly labeled citrate, indicating entry of two-carbon units into the TCA cycle via pyruvate dehydrogenase. (B) HSV-1 induces rapid formation of triply labeled citrate, indicating entry of three-carbon units into the TCA cycle via pyruvate carboxylase. (Adapted from Vastag et al. 2011.)
Figure 6
Figure 6
HCMV hijacks host cell metabolism, directing carbon toward fatty acids. Metabolic map shows concentration and flux changes induced by HCMV infection. Font sizes represent metabolite pool sizes in uninfected cells, arrow widths show net fluxes in uninfected cells, and the color scale indicates the fold change in concentrations and fluxes induced by HCMV. Metabolites in gray were not measured. Note that the strongest flux changes are in the TCA cycle and its efflux toward fatty acids (Munger et al. 2008).
Figure 7
Figure 7
The acetyl-CoA carboxylase inhibitor tetradecyloxy-2-furoic acid causes a >1000-fold inhibition of HCMV replication. (A) Viral titers. (B) Viability of uninfected quiescent fibroblasts. (Based on data from Vastag et al. 2011.)
Figure 8
Figure 8
Mutant isocitrate dehydrogenase-1 (IDH1) produces the oncometabolite 2-hydroglutarate (2HG). (A) LC–high-resolution MS analysis of glioblastoma cells expressing wild-type IDH1 or the IDH1 R132H mutant. Expression of the mutant enzyme strongly increases three coeluting ion peaks, all of which form during electrospray ionization of 2HG: Peak A is [2HG-H], peak B is [2HG-H3O], and peak C is [2HG + Na − 2H]. (B) Analysis of TCA cycle intermediate concentrations from glioblastoma tumor specimens with wild-type or mutant IDH1. (Adapted from Dang et al. 2009.)

References

    1. Bajad SU, Lu W, Kimball EH, Yuan J, Peterson C, Rabinowitz JD. Separation and quantitation of water soluble cellular metabolites by hydrophilic interaction chromatography–tandem mass spectrometry. J Chromatogr A. 2006;1125:76–88. - PubMed
    1. Baran R, Kochi H, Saito N, Suematsu M, Soga T, Nishioka T, Robert M, Tomita M. MathDAMP: A package for differential analysis of metabolite profiles. BMC Bioinformatics. 2006;7:530. - PMC - PubMed
    1. Beger RD, Hansen DK, Schnackenberg LK, Cross BM, Fatollahi JJ, Lagunero FT, Sarnyai Z, Boros LG. Single valproic acid treatment inhibits glycogen and RNA ribose turnover while disrupting glucose-derived cholesterol synthesis in liver as revealed by the [U-C(6)]-D-glucose tracer in mice. Metabolomics. 2009;5:336–345. - PMC - PubMed
    1. Brauer MJ, Yuan J, Bennett BD, Lu W, Kimball E, Botstein D, Rabinowitz JD. Conservation of the metabolomic response to starvation across two divergent microbes. Proc Natl Acad Sci. 2006;103:19302–19307. - PMC - PubMed
    1. Brindle JT, Antti H, Holmes E, Tranter G, Nicholson JK, Bethell HW, Clarke S, Schofield PM, McKilligin E, Mosedale DE, Grainger DJ. Rapid and noninvasive diagnosis of the presence and severity of coronary heart disease using 1H-NMR-based metabonomics. Nat Med. 2002;8:1439–1444. - PubMed

Publication types

LinkOut - more resources