. 2012 Feb;86(3):1433-48.
doi: 10.1128/JVI.05820-11. Epub 2011 Nov 23.

Replication-competent influenza A virus that encodes a split-green fluorescent protein-tagged PB2 polymerase subunit allows live-cell imaging of the virus life cycle

Affiliations

Replication-competent influenza A virus that encodes a split-green fluorescent protein-tagged PB2 polymerase subunit allows live-cell imaging of the virus life cycle

Sergiy V Avilov et al. J Virol. 2012 Feb.

Abstract

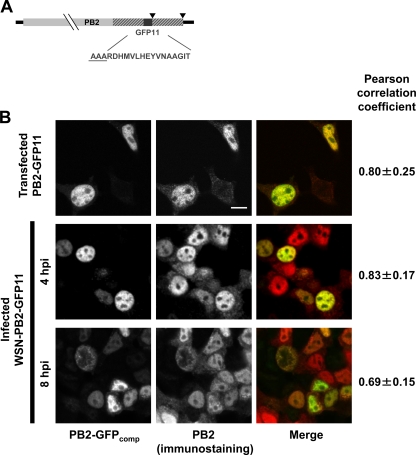
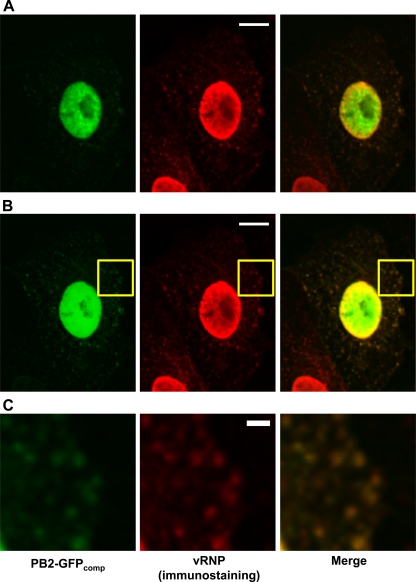
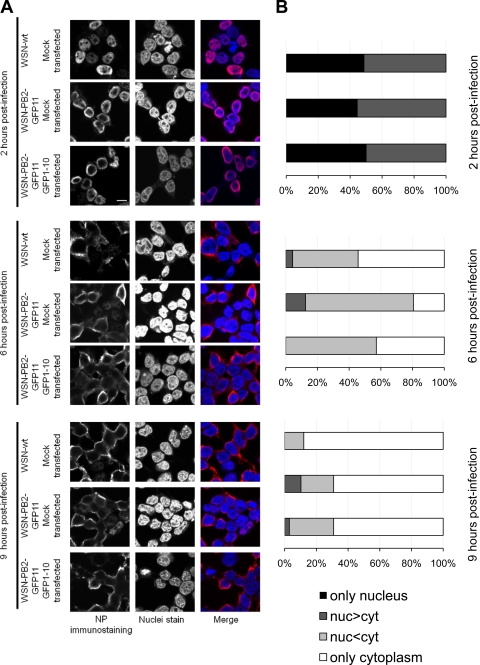
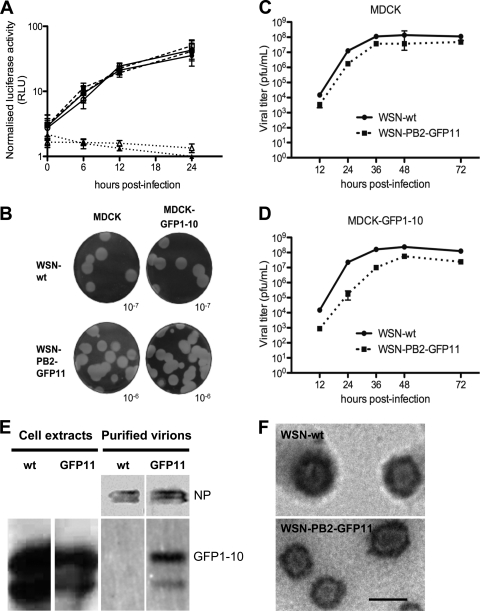
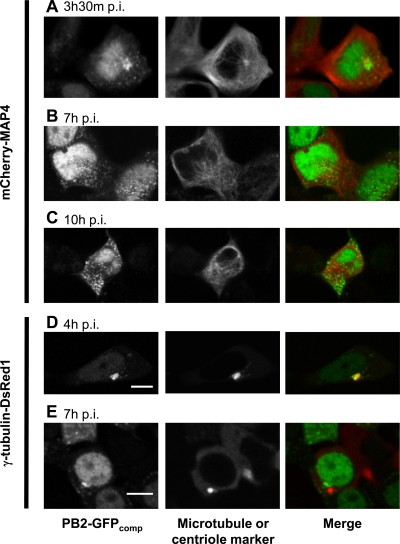
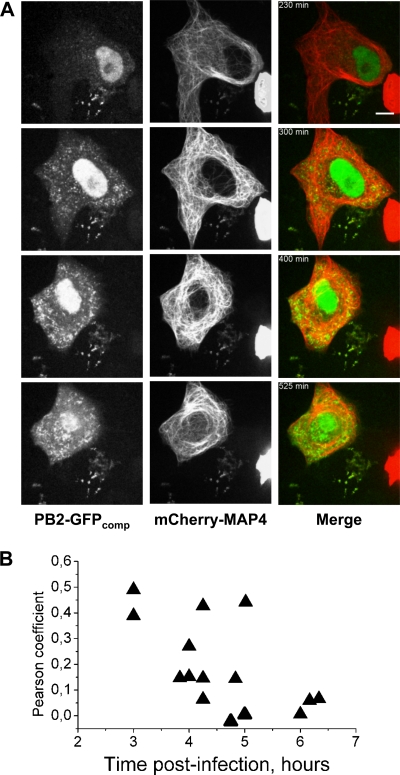
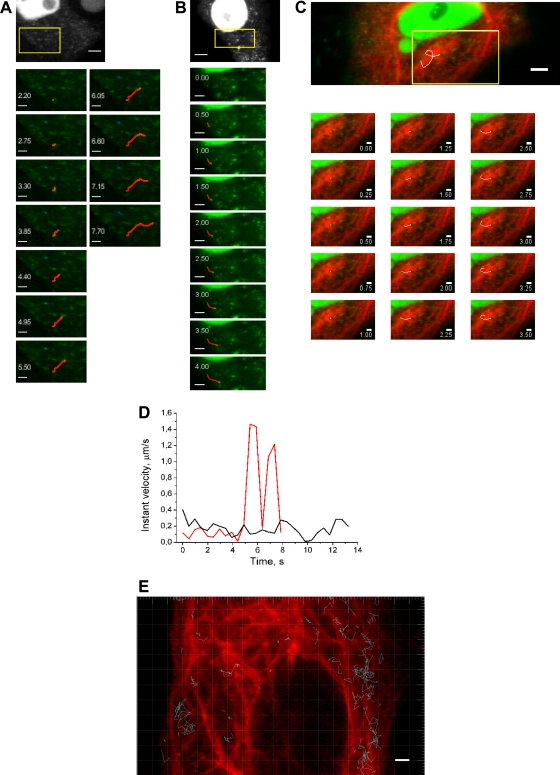
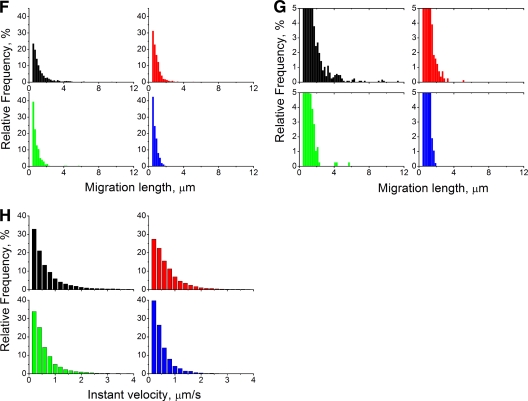
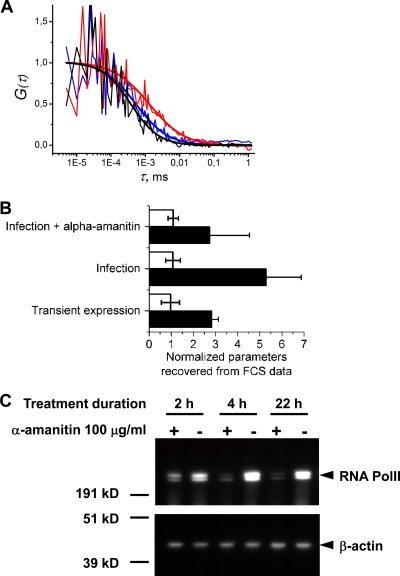
Studies on the intracellular trafficking of influenza virus ribonucleoproteins are currently limited by the lack of a method enabling their visualization during infection in single cells. This is largely due to the difficulty of encoding fluorescent fusion proteins within the viral genome. To circumvent this limitation, we used the split-green fluorescent protein (split-GFP) system (S. Cabantous, T. C. Terwilliger, and G. S. Waldo, Nat. Biotechnol. 23:102-107, 2005) to produce a quasi-wild-type recombinant A/WSN/33/influenza virus which allows expression of individually fluorescent PB2 polymerase subunits in infected cells. The viral PB2 proteins were fused to the 16 C-terminal amino acids of the GFP, whereas the large transcomplementing GFP fragment was supplied by transient or stable expression in cultured cells that were permissive to infection. This system was used to characterize the intranuclear dynamics of PB2 by fluorescence correlation spectroscopy and to visualize the trafficking of viral ribonucleoproteins (vRNPs) by dynamic light microscopy in live infected cells. Following nuclear export, vRNPs showed a transient pericentriolar accumulation and intermittent rapid (∼1 μm/s), directional movements in the cytoplasm, dependent on both microtubules and actin filaments. Our data establish the potential of split-GFP-based recombinant viruses for the tracking of viral proteins during a quasi-wild-type infection. This new virus, or adaptations of it, will be of use in elucidating many aspects of influenza virus host cell interactions as well as in screening for new antiviral compounds. Furthermore, the existence of cell lines stably expressing the complementing GFP fragment will facilitate applications to many other viral and nonviral systems.


Figures

Fig 1
Fig 1
(A) Schematic representation of the PB2-GFP11 genomic segment. The PB2 ORF (light gray box) is fused to the sequence encoding the GFP11 domain (dark gray box) and is flanked by the 3′ and 5′ noncoding regions (black lines). The duplicated PB2 ORF sequences are represented as hatched boxes. The stop codons are indicated by black arrowheads. The GFP11 amino acid sequence is indicated. The three-alanine linker at the junction between PB2 and GFP11 is underlined. (B) Colocalization of the PB2-GFPcomp signal with PB2-specific immunofluorescence signal. 293T cells were transfected with the GFP1-10 expression plasmid, subsequently infected with the WSN-PB2-GFP11 virus at an MOI of 3, and fixed at indicated times or cotransfected with the PB2-GFP11 and GFP1-10 expression plasmids and fixed at 48 h posttransfection. Immunostaining was performed as described in Materials and Methods, using anti-PB2 monoclonal antibodies. On the merged images, PB2-GFPcomp and immunostaining signals are pseudo-colored green and red, respectively. Scale bar, 10 μm. Pearson correlation coefficient, as determined on GFP1-10 expressing cells, is indicated on the right (mean ± SD; 3 to 8 cells per condition). The cells which were not transfected with GFP1-10 plasmid and did not develop GFP fluorescence were not included in the colocalization analysis.
Fig 2
Fig 2
Colocalization of the PB2-GFPcomp signal with vRNP-specific immunofluorescence signal. Vero cells were transfected with the GFP1-10 expression plasmid, subsequently infected with the WSN-PB2-GFP11 virus at an MOI of 3, and fixed at 6 h 30 min postinfection. Immunostaining was performed as described in Materials and Methods, using the MAb 3/1. On the merged images, PB2-GFPcomp and immunostaining signals are pseudo-colored green and red, respectively. (A) The microscope settings were optimized for the acquisition of nuclear signals. Scale bar, 10 μm. (B) The microscope settings were optimized for the acquisition of cytoplasmic signals. Scale bar, 10 μm. (C) Zoomed-in image of the area defined by a yellow rectangle in panel B. Scale bar, 2 μm.
Fig 3
Fig 3
Intracellular distribution of NP in 293T cells infected with the WSN-wt or WSN-PB2-GFP11 virus. Mock-transfected 293T cells were infected with the WSN-wt or WSN-PB2-GFP11 virus at an MOI of 3. 293T cells transfected with the GFP1-10 expression plasmid were infected with the WSN-PB2-GFP11 virus at an MOI of 3. At 2, 6, and 9 h postinfection, immunofluorescence assays were performed as described in Materials and Methods, using an anti-NP monoclonal antibody. (A) Representative images. In the merged images, the NP-specific staining and DAPI nucleic acid staining were pseudo-colored red and blue, respectively. Scale bar, 10 μm. (B) Quantification of NP nuclear and cytoplasmic distribution. The cells were classified according to the mean intensities of NP-specific immunostaining signal (corrected for nonspecific staining) in their nuclei and cytoplasms. The proportions of cells showing only nuclear, more nuclear than cytoplasmic (nuc>cyt), less nuclear than cytoplasmic (nuccomp fluorescent signal were selected for analysis.
Fig 4
Fig 4
Phenotypic comparison of the WSN-wt and WSN-PB2-GFP11 viruses. (A) A plasmid allowing the expression of a pseudo-viral Renilla luciferase reporter RNA was cotransfected with a firefly luciferase expression plasmid in A549 cells (open symbols) or A549-GFP1-10 cells (closed symbols). At 24 h posttransfection, cells were either mock infected (dotted lines), infected with the WSN-wt virus (solid lines), or infected with the WSN-PB2-GFP11 virus (dashed lines) at an MOI of 5 PFU/cell. The Renilla luciferase activities measured in cell extracts at the indicated times postinfection were normalized with respect to firefly luciferase activities and are expressed as the mean ± SD of quadruplicates. RLU, relative light units. (B) Plaque phenotype of the WSN-wt and WSN-PB2-GFP11 viruses assayed on MDCK and MDCK-GFP1-10 cells. Cell monolayers were stained with crystal violet after 72 h of incubation at 35°C. The dilutions of the viral stock used for infection are indicated. (C and D) Growth curves of the WSN-wt (solid lines) and WSN-PB2-GFP11 viruses (dashed lines) on MDCK or MDCK-GFP1-10 cells. Cell monolayers were infected at an MOI of 0.001 and incubated for 72 h at 35°C. At the indicated time points, the supernatants were harvested, and virus titers were determined by plaque assays on MDCK cells. (E) Western blot analysis of WSN-wt and WSN-PB2-GFP11 purified virions produced from MDCK cells stably expressing GFP1-10. (F) Electron microscopy images of the WSN-wt and WSN-PB2-GFP11 virions, which correspond to lanes 3 and 4 in panel E, respectively. Scale bar, 100 nm.
Fig 5
Fig 5
Imaging of the PB2-GFPcomp protein in live 293T cells infected with the WSN-PB2-GFP11 virus. (A) Selected frames from Movie S1A in the supplemental material showing individual PB2-GFPcomp-positive 293T cells at the times postinfection indicated (min). 293T cells transiently expressing GFP1-10 were infected at an MOI of 3 with the WSN-PB2-GFP11 virus, and images (PB2-GFPcomp signal) of live cells throughout the infectious cycle were acquired with a Leica TCS SP2 AOBS microscope, as described in Materials and Methods. Single confocal slices are shown. Brightness and contrast were adjusted for the whole series of images. Arrowheads point to the cell used for quantification shown on Fig. 5C. Scale bar, 10 μm. (B) 293T cells transfected with GFP1-10 and infected with WSN-PB2-GFP11 virus, imaged (PB2-GFPcomp signal) 9 h (left) and 1 day (right) postinfection. Accumulation of PB2-GFPcomp at the plasma membrane is indicated by arrowheads. Scale bars, 10 μm. (C) Quantification of PB2-GFPcomp content over time in representative infected cells treated with 20 nM leptomycin B (red lines) and mock treated (black lines; the corresponding cell is marked with arrowheads in Fig. 5A). PB2-GFPcomp mean fluorescence intensities corrected for background in an ROI in the nucleus (dash-dotted line) and in an ROI in the cytoplasm (dashed line) are represented. Positions and shapes of the ROIs were manually adjusted in each frame to cover significant portions of the appropriate compartments of the cell. au, arbitrary units. (D) Effect of leptomycin B treatment on the intracellular distribution of the PB2-GFPcomp protein in live 293T cells transiently expressing GFP1-10 and infected at an MOI of 3 with the WSN-PB2-GFP11 virus. After viral adsorption, cells were incubated with 15 nM leptomycin B or with the corresponding dilution of dimethyl sulfoxide. Representative images of PB2-GFPcomp-expressing cells acquired at 6 h postinfection are shown. Brightness and contrast were adjusted for presentation purposes. Scale bar, 10 μm. (E) Effect of leptomycin B treatment on the intracellular distribution of the PB2-GFPcomp protein in live infected cells. Values are the ratio of nuclear to cytoplasmic intensities of PB2-GFPcomp fluorescence in the absence (black bars) or presence (gray bars) of leptomycin B. The data are shown as mean values ± SD calculated from >10 cells/condition.
Fig 6
Fig 6
Covisualization of the PB2-GFPcomp protein with microtubule network markers in live infected cells. 293T cells transiently expressing GFP1-10 and mCherry-MAP4 (A to C) or γ-tubulin-DsRed1 (D and E) fusion proteins were infected at an MOI of 3 with the WSN-PB2-GFP11 virus. The PB2-GFPcomp and mCherry-MAP4/γ-tubulin–DsRed1 fluorescence signals in live cells were acquired with a Leica TCS SP2 AOBS microscope, as described in Materials and Methods. Merged images are shown in which the PB2-GFPcomp signal is pseudo-colored green and Cherry-MAP4 or γ-tubulin–DsRed1 signal is pseudo-colored red. Scale bar, 10 μm.
Fig 7
Fig 7
FRAP analysis of perinuclear PB2-GFPcomp particles in live infected cells. 293T cells transiently expressing GFP1-10 were infected at an MOI of 3 with the WSN-PB2-GFP11 virus. Representative data set of a FRAP experiment (squares) and the fitted curve (solid line). The signal was background subtracted, normalized to the prebleach level, and corrected for photobleaching during acquisition. The prebleach signal level is shown as a dashed line.
Fig 8
Fig 8
Time-lapse imaging of live infected cells and colocalization analysis for PB2-GFPcomp and microtubules. (A) A representative Vero cell transiently expressing GFP1-10 and mCherry-MAP4 and infected with the WSN-PB2-GFP11 virus. Selected frames from a time-lapse series (see Movie S2 in the supplemental material) acquired during ∼700 min with 5-min intervals using an Andor Revolution Nipkow disk microscope, as described in Materials and Methods, are shown. In merged images, the PB2-GFPcomp and Cherry-MAP4 signals are pseudo-colored green and red, respectively. Scale bar, 10 μm. (B) Colocalization between PB2-GFPcomp and mCherry-MAP4 in the cytoplasm of infected cells, as characterized by the Pearson coefficient, throughout the course of infection. Each triangle represents the Pearson coefficient measured in an individual cell (data from four independent infections are shown).
Fig 9
Fig 9
Single-particle tracking of PB2-GFPcomp particles in live Vero cells infected with the WSN-PB2-GFP11 virus. Vero cells transiently expressing GFP1-10 and mCherry-MAP4 or mRuby-lifeact were infected at an MOI of 3 with the WSN-PB2-GFP11 virus and incubated with either 30 μM nocodazole, 2.5 μM cytochalasin D, a combination of 30 μM nocodazole with cytochalasin D, or with dimethyl sulfoxide (mock treatment). The image series was acquired at 6 to 9 h postinfection and no later than 1 h after the addition of cytochalasin D. Single-particle tracking analysis was performed on GFP-positive particles detected in the cytoplasm. (A to C) Selected frames from the time-lapse series, corresponding to the areas defined by the yellow rectangles on the full-frame images: mock treatment (A), treatment with nocodazole (B), and mock treatment, overlaid on the image of microtubules (mCherry-MAP4; red) acquired immediately before time series recording (C). Time (in seconds) is indicated. Representative tracks of rapid and directional motions of PB2-GFPcomp are shown as red lines (A and B), and a track of a randomly moving particle is shown as a blue line (A). A track apparently overlapping with microtubules is shown as a white line (C). Scale bars, 5 μm (full-frame images) and 2 μm (magnified images). (D) Variation of PB2-GFPcomp particle instant velocity over time. Data from two representative tracks with (red line) and without (black line) a transient rapid motion are shown. (E) Tracks of PB2-GFPcomp particles (blue lines) overlaid on the image of the microtubule network (mCherry-MAP4 signal acquired at zero time point, pseudo-colored red) in a representative cell. Scale bar, 2 μm. (F to H) Distribution of the migration lengths (distance between the initial and the final positions) (F and G) and distribution of the instant velocities (H) of PB2-GFPcomp particles. Data from ≈900 to 2,200 tracks per condition are presented. Red, 30 μM nocodazole-treated cells; green, 2.5 μM cytochalasin D-treated cells; blue, nocodazole and cytochalasin D-treated cells; black, mock-treated cells (dimethyl sulfoxide). In panel G, the y scale was stretched in order to highlight the distribution for small values.
Fig 9
Fig 9
Single-particle tracking of PB2-GFPcomp particles in live Vero cells infected with the WSN-PB2-GFP11 virus. Vero cells transiently expressing GFP1-10 and mCherry-MAP4 or mRuby-lifeact were infected at an MOI of 3 with the WSN-PB2-GFP11 virus and incubated with either 30 μM nocodazole, 2.5 μM cytochalasin D, a combination of 30 μM nocodazole with cytochalasin D, or with dimethyl sulfoxide (mock treatment). The image series was acquired at 6 to 9 h postinfection and no later than 1 h after the addition of cytochalasin D. Single-particle tracking analysis was performed on GFP-positive particles detected in the cytoplasm. (A to C) Selected frames from the time-lapse series, corresponding to the areas defined by the yellow rectangles on the full-frame images: mock treatment (A), treatment with nocodazole (B), and mock treatment, overlaid on the image of microtubules (mCherry-MAP4; red) acquired immediately before time series recording (C). Time (in seconds) is indicated. Representative tracks of rapid and directional motions of PB2-GFPcomp are shown as red lines (A and B), and a track of a randomly moving particle is shown as a blue line (A). A track apparently overlapping with microtubules is shown as a white line (C). Scale bars, 5 μm (full-frame images) and 2 μm (magnified images). (D) Variation of PB2-GFPcomp particle instant velocity over time. Data from two representative tracks with (red line) and without (black line) a transient rapid motion are shown. (E) Tracks of PB2-GFPcomp particles (blue lines) overlaid on the image of the microtubule network (mCherry-MAP4 signal acquired at zero time point, pseudo-colored red) in a representative cell. Scale bar, 2 μm. (F to H) Distribution of the migration lengths (distance between the initial and the final positions) (F and G) and distribution of the instant velocities (H) of PB2-GFPcomp particles. Data from ≈900 to 2,200 tracks per condition are presented. Red, 30 μM nocodazole-treated cells; green, 2.5 μM cytochalasin D-treated cells; blue, nocodazole and cytochalasin D-treated cells; black, mock-treated cells (dimethyl sulfoxide). In panel G, the y scale was stretched in order to highlight the distribution for small values.
Fig 10
Fig 10
FCS analysis of PB2-GFPcomp protein dynamics in the nuclei of live infected cells. 293T cells transiently expressing GFP1-10 were infected at an MOI of 3 with the WSN-PB2-GFP11 virus, incubated in the absence or presence of 100 μg/ml α-amanitin from 2 h postinfection, and submitted to FCS measurements from 4 to 6.5 h postinfection as described in Materials and Methods. 293T cells cotransfected with the GFP1-10 and MBD-GFP11 expression vectors were used as a control. (A) Representative raw individual autocorrelation curves and the curves obtained by global fitting of 12 to 20 individual curves/condition are shown for cells expressing the MBD-GFP11 protein (black curves) and cells infected with WSN-PB2-GFP11 without (red curves) or with (blue curves) α-amanitin treatment. (B) The characteristic diffusion time (black bars) and molecular brightness (white bars) recovered from FCS data analysis. The values measured for PB2-GFP11 transient expression, WSN-PB2-GFP11 infection, and WSN-PB2-GFP11 infection in the presence of α-amanitin (originally in ms and in counts per second per particle, respectively) were normalized with respect to the corresponding values for the transiently expressed MBD-GFP11 protein. In each transfection/infection experiment, 8 to 20 individual autocorrelation curves were acquired for each condition. The diffusion time for each condition was determined from global fitting of all curves acquired under that condition. The data are shown as mean values ± SD of two to four independent transfection/infection experiments. (C) Western blot analysis of RNA Pol II steady-state levels in α-amanitin-treated cells. 293T cells were incubated in the absence (−) or presence (+) of 100 μg/ml of α-amanitin for the indicated time. Whole-cell lysates were prepared, loaded on a denaturing polyacrylamide gel, and analyzed by Western blotting using monoclonal antibodies specific for the human RNA Pol II large subunit and ß-actin, as described in Materials and Methods. Protein molecular mass markers (kD) are indicated.

References

    1. Amorim MJ, et al. 2011. A Rab11- and microtubule-dependent mechanism for cytoplasmic transport of influenza A virus viral RNA. J. Virol. 85:4143–4156 - PMC - PubMed
    1. Beignon AS, et al. 2009. Lentiviral vector-based prime/boost vaccination against AIDS: pilot study shows protection against Simian immunodeficiency virus SIVmac251 challenge in macaques. J. Virol. 83:10963–10974 - PMC - PubMed
    1. Bruce EA, Digard P, Stuart AD. 2010. The Rab11 pathway is required for influenza A virus budding and filament formation. J. Virol. 84:5848–5859 - PMC - PubMed
    1. Cabantous S, Terwilliger TC, Waldo GS. 2005. Protein tagging and detection with engineered self-assembling fragments of green fluorescent protein. Nat. Biotechnol. 23:102–107 - PubMed
    1. Crescenzo-Chaigne B, Naffakh N, van der Werf S. 1999. Comparative analysis of the ability of the polymerase complexes of influenza viruses type A, B and C to assemble into functional RNPs that allow expression and replication of heterotypic model RNA templates in vivo. Virology 265:342–353 - PubMed

Publication types

MeSH terms

Substances

LinkOut - more resources