. 2011 Nov;7(11):e1002375.
doi: 10.1371/journal.ppat.1002375. Epub 2011 Nov 17.

A TNF-regulated recombinatorial macrophage immune receptor implicated in granuloma formation in tuberculosis

Affiliations

A TNF-regulated recombinatorial macrophage immune receptor implicated in granuloma formation in tuberculosis

Alexander W Beham et al. PLoS Pathog. 2011 Nov.

Abstract

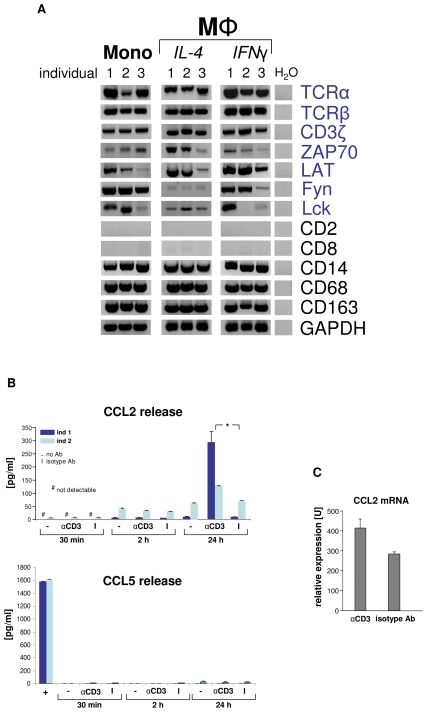
Macrophages play a central role in host defense against mycobacterial infection and anti- TNF therapy is associated with granuloma disorganization and reactivation of tuberculosis in humans. Here, we provide evidence for the presence of a T cell receptor (TCR) αβ based recombinatorial immune receptor in subpopulations of human and mouse monocytes and macrophages. In vitro, we find that the macrophage-TCRαβ induces the release of CCL2 and modulates phagocytosis. TNF blockade suppresses macrophage-TCRαβ expression. Infection of macrophages from healthy individuals with mycobacteria triggers formation of clusters that express restricted TCR Vβ repertoires. In vivo, TCRαβ bearing macrophages abundantly accumulate at the inner host-pathogen contact zone of caseous granulomas from patients with lung tuberculosis. In chimeric mouse models, deletion of the variable macrophage-TCRαβ or TNF is associated with structurally compromised granulomas of pulmonary tuberculosis even in the presence of intact T cells. These results uncover a TNF-regulated recombinatorial immune receptor in monocytes/macrophages and demonstrate its implication in granuloma formation in tuberculosis.


Conflict of interest statement

The authors have declared that no competing interests exist.

Figures

Figure 1
Figure 1. ΤCRαβ expression by subpopulations of human and murine monocytes/macrophages.
(A) Fluorescence immunocytochemistry demonstrating that a ∼5% subpopulation of human peripheral blood CD14+/MHC-II+ monocytes expresses the ΤCRαβ. CD14-MACS purified peripheral blood monocytes were isolated from a healthy donor and double-immunostained with Abs against the ΤCRαβ (red) and MHC-II (green). Isotype controls for the anti-ΤCRαβ and anti-MHC-II antibodies are shown (right). Scale bars are indicated. Data shown are representative of n = 12 donors. (B) Flow cytometry of peripheral blood mononuclear cells from a healthy individual demonstrates the presence of the TCRβ on the surface of a CD14+ monocyte subpopulation (3.5%, red arrows). Staining for TCRβ and lineage surface markers are shown. CD14+ monocytes are in pink color, CD3+ lymphocytes in blue. (C) (Left) Laser scanning cytometry (LSC) of unstimulated (naïve) monocyte-derived macrophages stained for ΤCRαβ (red). Nuclei are counterstained with DAPI (blue). The cytometric analysis shows a subpopulation (5%) with high fluoresence indicative of ΤCRαβ positive naïve macrophages (top right) which is highlighted in the histogram below (arrow). (Bottom) LSC of naïve and IL-4 (10 ng/ml) or IFNγ (1000 U/ml) stimulated monocyte-derived macrophages, respectively, cultured for 6 days. The percentage of ΤCRαβ+ cells in each macrophage population is shown for three healthy individuals. (D) Detection of the TCR α- and β-chain in CD14+ monocytes and IFNγ or IL-4 polarized macrophages by immunoblot. β-actin, loading control. (E) Immunogold electron microscopy demonstrating the presence of the TCR α-subunit on the cell surface of a human IFNγ stimulated macrophage (arrows). (Right) isotype control. (F) Immunocytochemical double-staining reveals the presence of the TCRαβ (green) in alveolar macrophages from a 45 year old male with normal BAL cytology. Shown is a ΤCRαβ+ alveolar macrophage (top right, arrow) next to a ΤCRαβ+ T cell (asterisk). The merged image (bottom right) demonstrates that the majority of the cells express the macrophage marker CD163 (red). Giemsa-staining of the BAL cytospin preparation and isotype controls are shown in the left panel. The results are representative of three individuals. Nuclei (blue), DRAQ5. (G) Confocal immunofluorescence microscopy shows ΤCRαβ expression in murine macrophages. Spleen macrophages pooled from three normal C57BL/6 J mice were CD11b-MACS purified and immunofluorescence double-staining was performed using the anti-macrophage antibody F4/80 (red) and an anti-mouse TCRβ antibody that recognizes a common epitope of the murine TCRαβ complex (green). The outlined area is shown at a higher magnification. Nuclei (blue) are counterstained with DRAQ5. Isotype controls are shown. (Bottom) RT-PCR demonstrating expression of the murine TCRα and TCRβ constant chain genes in CD11b-MACS purified spleen macrophages (MΦ) from C57Bl6/J mice. Ly6G+ neutrophils are shown as positive control.
Figure 2
Figure 2. The monocyte/macrophage TCRαβ is a recombinatorial receptor.
(A) Detection of D → J (i) and V → DJ (ii) rearrangements in the TCRβ gene locus of human CD14+ monocytes and IFNγ macrophages. Arrows denote the presence of Dβ1→ Jβ and Vβ1→ Jβ rearrangements which were confirmed by sequencing. Genomic organization of the identified rearrangements is schematically drawn. Peripheral blood mononuclear cells (PBMC), positive control. HepG2 cells, Ø control. (B) Expression of individual-specific TCR Vβ repertoires by monocytes, IL-4 macrophages (blue) and IFNγ macrophages (red) from three healthy donors (1–3) representatively shown for Vβ13a. A scaled synopsis of the three cell populations is shown at the bottom (∑). (C) TCR clonotype analysis by sequencing of the antigen-binding CDR3 loop of Vβ13a representatively shown for individual 2. IL-4 (blue) and IFNγ activated macrophages (red) express completely different Vβ13a clonotypes. The Vβ13a chain is not expressed by the monocytes of this individual (cf. B). Colored letters represent deduced amino acid sequences of the newly identified CDR3β regions (GenBank Acc. No. JF923737-JF923744). D) Expression of rearranged TCR Vβ CDR3 clonotypes in granulocyte/macrophage progenitor colonies (CFU-GM) obtained from CD34+ progenitors of two healthy individuals (A and B). Filled boxes indicate positive expression of at least one of the 25 known human TCR Vβ chains (x-axis) in a single colony. Colonies are identified by numbering on the y-axis. The repertoires for each of the expressed Vβ chains were determined by length variant analysis of the antigen-binding CDR3β region. The detailed Vβ repertoire is representatively shown for colony CFU-GM2 (donor B). The repertoires of additional CFU-GM colonies are summarized in Figure S2B. RT-PCR lineage marker expression profiling documents the monocytic nature of this granulocyte/macrophage progenitor colony. CD2, CD8: T lymphoid markers; MMP25, MPO: granulocyte markers; CD14, CD68, CD163: monocyte markers. (E) Direct mass spectrometric identification of multiple TCR Vα- and Vβ-chain variants in human macrophages. Protein lysates from IFNγ macrophages of a healthy donor were immunoprecipitated using an anti-TCRβ antibody and the predicted 58 kD band (boxed) was analyzed by MALDI-TOF mass spectrometry. Peaks 1–6 represent TCR Vα- and Vβ-specific peptide fragments whose amino acid sequence identities with known TCR Vαβ-clonotypes are bolded. In three cases (2, 4 and 6), the identified peptides span V→ J and J→ C junctions (denoted by a gap) indicative of genomic rearrangements in the macrophage TCRα and -β loci. (F) Peritoneal macrophages from C57Bl6/J mice (rag1+/+) but not recombination defective rag1–/– mice express Vα (left) and Vβ repertoires (right) as evidenced by TCR V-chain mRNA expression profiling (top) and CDR3 spectratyping of representative TCR Vα- and Vβ-chains (bottom). Peritoneal macrophages were pooled from three rag1+/+ mice and an equal number of rag1–/– mice, respectively.
Figure 3
Figure 3. Engagement of the macrophage TCRαβ induces CCL2 release.
(A) Circulating human monocytes (Mono), IL-4 activated and IFNγ activated macrophages (MΦ), respectively, constitutively express the genes for the TCRαβ chains and integral components of the TCR signalling complex (CD3ζ, ZAP70, LAT, Fyn, Lck). RT-PCR profiling is shown for three representative healthy individuals (1–3). Expression of T cell (CD2, CD8) and monocyte/macrophage marker genes (CD14, CD68, CD163) are demonstrated as reference. Peripheral blood monocytes were isolated by CD14-MACS and differentiation into Th1 (IFNγ) and Th2 (IL-4) polarized MΦ was induced for 6 days. ZAP70, CD3ζ associated protein kinase 70; LAT, linker for T cell activation; Fyn, Lck, src family tyrosine kinases; H2O, negative control. (B) CD3 mediated TCR activation induces selective CCL2 release from macrophages. Aliquots of 5×10⁵ IFNγ macrophages were incubated with soluble antibodies to CD3, isotype control antibodies (I) or in the absence of antibodies (-) for the indicated timepoints. CCL2 and 14 additional cytokines (Table S1) were determined in the supernatant by multiplex cytokine assay. The near absence of the T cell secretory protein CCL5 documents that macrophages were virtually free of T lymphocytes (bottom). Macrophages were collected from two healthy donors (ind 1, ind 2). +, CD3+ T cells (positive control). *p<0.05. (C) TCR engagement upregulates CCL2 gene expression in macrophages as assessed by quantitative RT-PCR (qPCR). The results shown represent the qPCR analysis of IFNγ macrophages from three healthy donors that were stimulated with anti-CD3 antibodies for 24 h.
Figure 4
Figure 4. The macrophage TCRαβ modulates phagocytosis.
(A) Schematic representation of the phagocytosis assay used for targeting of baits to the macrophage TCRαβ. IFNγ polarized macrophages were challenged with polystyrene bead baits (Ø 4.5 µm) coated with anti-TCRαβ antibodies for 15 min, 1 h and 10 h, respectively, and uptake of beads was recorded. Beads coated with nonspecific IgG antibodies, potentially binding to the Fcγ receptor (FcγR), anti-CD11b antibodies targeting the complement receptor 3 (CR3) and albumin (irrelevant protein) served as controls. In addition, macrophages were challenged with uncoupled anti-TCRαβ antibodies in the presence of albumin-coated bead baits. (B) Enhanced phagocytosis of baits targeted to the macrophage TCRαβ. Shown is the time course analysis of the percentage of phagocytosing cells (left) and the bead/cell ratios (right) in IFNγ macrophages that were challenged with bead baits as detailed in (A). IFNγ macrophages from two healthy donors were incubated with beads (MΦ:beads  =  1∶1, 5 µg Ab/107 beads) for the indicated timepoints. Quantitation of phagocytosed beads was performed by bright field microscopy of at least 12 randomly selected fields of vision. P values refer to beads targeted to the TCR (green) or the CR3 (blue). *p<0.05, ** p<0.01, ***p<0.001; ns, not significant. (C) Representative unstained cytospin preparations (40x) of IFNγ macrophages from donor 1 that were challenged with bead baits targeted to the TCRαβ (top left) or albumin-coated beads in the presence of uncoupled anti- TCRαβ antibodies (control, top right). DAB immunostaining of two adjacent macrophages (bottom, 100x) demonstrates the presence of the TCRαβ (arrows) in immediate proximity to two ingested beads that were targeted to this immune receptor. The quantitative analysis of phagocytosed beads from this individual is shown in (B). (D) Reduced phagocytosis of M. bovis BCG by macrophages from recombination defective rag1–/– mice which lack the recombinatorial TCRαβ. Thioglycollate-elicited peritoneal macrophages from rag1–/– mice and rag1+/+ wildtype control mice were infected with FITC-labeled M. bovis BCG (MΦ:BCG  =  1∶10) and the phagocytic index was determined at the indicated timepoints by digital analysis of fluorescent images. ***p<0.001. The data are based on the quantitative analysis of 7 pooled rag1–/– mice and an equal number of rag1+/+ mice. The fluorescent image (bottom) representatively shows rag1+/+ peritoneal macrophages after 6 h of infection with BCG. Arrows highlight ingested BCG mycobacteria. Nuclei, DAPI (blue).
Figure 5
Figure 5. Infection of macrophages with M. bovis BCG induces TCRαβ expression in vitro.
(A) Immunofluorescence double-staining demonstrating co-localization of BCG mycobacteria (green) and the macrophage-TCRαβ (red) after 6 days of infection (i). Nuclei are stained with DAPI. Arrows highlight two double-stained points of spatial proximity (yellow fluorescence). (ii) Immunogold electron microscopy of a BCG containing phagosome in an IFNγ macrophage. The presence of a single TCRαβ in the immediate neighborhood of a BCG mycobacterium is shown at a higher magnification (arrow). (B) Confocal image of a TCRαβ expressing macrophage cluster induced in response to in vitro infection with BCG. Uninfected IFNγ macrophages from the same donor are shown left. White arrows highlight TCRαβ+ macrophages. A quantitative analysis of the percentage of TCRαβ+ cells (right) and isotype controls are shown. **p<0.01. IFNγ macrophages were incubated in the presence or absence of FITC-labeled BCG for 6 days. The results represent two healthy individuals (donors A and B). Donor B see Figure S4A. (Bottom) RT-PCR demonstrating increased expression of the TCR α- and β-chain genes in the BCG infected macrophages from both donors. GAPDH expression is shown as reference. (C) Synopsis of the TCR Vβ repertoires expressed by the BCG infected and uninfected macrophages shown in (B) assessed by CDR3 spectratyping (donor A). (Bottom) Quantitative analysis of all Vβ CDR3 length variants expressed by both donors . * p = 0.07. (D) TCR Vβ repertoire analysis of randomly selected BCG/macrophage clusters from donor A reveals expression of highly restricted TCR Vβ chain repertoires. BCG/macrophage clusters 1–6 were subjected to RT-PCR and CDR3 spectratyping. The identified TCR Vβ repertoires are shown for each individual cluster. Note that next to the Vβ1 only few additional Vβ chains are expressed. The single peaks are indicative of monoclonality. The results are representative of two healthy individuals (donors A and B). Donor B see Figure S4B.
Figure 6
Figure 6. Massive accumulation of TCRαβ+ macrophages in the inner epithelioid cell corona of human tuberculous granulomas.
(A) Presence of the macrophage-TCRαβ in circumscribed caseous tuberculous granulomas. Light microscopic images i-iii reveal intense red/brown immunostaining for the TCRαβ in the inner host-pathogen contact zone (bars) of the granulomas at various magnifications. (iv, v) Staining for CD2. N, necrotic caseous core. The lung sections were obtained from a patient with pulmonary tuberculosis and are representative of 10 out of 13 randomly selected patients (Table S2). Immunofluorescence double-staining for the TCRαβ (red) and the macrophage marker CD68 indicates that the TCRαβ+ cells are macrophages (vi, yellow, merged). (vii) Mean percentage of CD68+/TCRαβ+ cells in the inner epithelioid cell corona of circumscribed caseous tuberculous granulomas from 8 different patients. Percentages of double positive cells in this zone (CD68+/TCRαβ+ cells : total number of nuclei) were determined from three sections of each patient. (B) Single immunostaining for the markers CD68 and CD163 demonstrates that macrophages represent the vast majority of cells in the epithelioid cell corona of the caseous tuberculous granulomas (i–iii). Staining for CD2 reveals that T cells and natural killer cells are predominantly located in the outer segment of the corona (iv). A focal accumulation of lymphocytes (L) located in the peripheral corona zone is shown in the right box (i,v). Note positive staining for CD2 (vi). Bars in all images span the inner host-pathogen contact zone. N, necrotic core. Isotype controls are shown in Figure S5A. ii–iv,vi: 40x. (C) Laser microdissection of a 20–30 cell cluster of CD68+/TCRαβ+ double-immunostained macrophages (encircled) from the inner host-pathogen contact zone of a caseous tuberculous granuloma. TCRαβ+, red; CD68+, green; scale bar, 75 µm. Dissected cells are highlighted in yellow (left). Ex situ Vβ CDR3 spectratype analysis of the excised cells reveals expression of restricted TCR Vβ1 repertoires.
Figure 7
Figure 7. TNF blockade inhibits expression of the macrophage-TCRαβ.
(A) Suppression of the TCRαβ in uninfected and BCG infected IFNγ macrophages in response to 2h treatment with the anti-TNF antibody infliximab (50 µg/ml). An irrelevant monospecific antibody (anti-CD20) was used as control. Macrophages were immunostained using an anti-TCRαβ antibody (Alexa 555-labeled, red). Representative fluorescent microscopy images are shown. Infection with BCG mycobacteria changes the staining pattern from diffuse surface staining to a bright central spot (arrows). Nuclei, DAPI (blue). (B) Anti-TNF treatment (infliximab) downregulates mRNA expression of the TCRβ constant chain in IFNγ macrophages as assessed by qPCR. Control, uninfected macrophages. (C) Downregulation of the ζ-subunit of the TCR signaling complex and increased levels of cleaved caspase 3 (D) in uninfected (controls, +TNF) and BCG infected IFNγ macrophages following TNF blockade (infliximab). Controls, untreated macrophages; +TNF, macrophages stimulated with TNF (10 ng/ml). Bar graphs (mean ± SEM) represent quantitative analyses of qPCR or densitometry of the immunoblots from two independent experiments. Representative immunoblots are shown. Whole cell lysates from IFNγ macrophages were immunoblotted using antibodies to TCRζ, cleaved caspase 3 and β-actin, respectively. Quantitative densitometrical analyses of the immunoblots was normalized to β-actin.
Figure 8
Figure 8. Loss of the macrophage-TCR in the presence of functional T cells results in disorganized granulomas and CCL2 suppression in murine pulmonary tuberculosis.
(A) TNF blockade decreases the number and size of macrophage clusters induced by BCG infection in vitro. IFNγ macrophages were infected with M. bovis BCG in the presence of the anti-TNF antibody infliximab (50 µg/ml) or an equal amount of an isotype antibody (anti-CD20) for the indicated timepoints. Bar graphs represent total numbers of small (<100000 pixels) and large macrophage clusters (100000–500000 pixels) that were formed. The area (number of pixels) of the macrophage clusters was determined from electronic images. The results (mean ± SEM) are based on the analysis of three independent donors. ** p<0.01, ***p<0.001. (B) Lung sections of wildtype (wt) mice demonstrating formation of compact, well-circumscribed tuberculous lesions after four weeks infection with M. tuberculosis (i). A higher magnification of the boxed granuloma is shown in (ii). In contrast, chimeric rag1–/–(T cell wt) mice that lack the macrophage-TCR but have intact T cells develop disorganized tuberculous lesions that are consistently larger and more diffuse than those of wildtypes (iii, iv higher magnification). All sections were immunostained for CCL2. Note intense CCL2 staining (brown) in the tuberculous lesions of wt mice but near absence of CCL2 in the macrophage-TCR deficient rag1–/–(T cell wt) chimeras (i–iv). Chimeric tnf–/–(T cell wt) mice with systemic deletion of TNF but wildtype T cells display disorganized granulomas characterized by absence of CCL2 (v, vi) similarly as observed in macrophage-TCR deficient mice (iii, iv). All mice were infected via aerosol with ∼ 100 M. tuberculosis bacilli at the time of adoptive T cell transfer. The lung sections shown are representative of 5-7 mice in each experimental group. Scale bars are indicated. (C) Increased size of tuberculous granulomas in chimeric rag1–/–(T cell wt) and tnf–/–(T cell wt) mice relative to wildtype controls. Shown is the mean percentage of the lung area covered by granulomatous foci infection with M. tuberculosis. Data were calculated from scanned lung cross sections and are based on the analysis of five mice in each group. * p<0.05.
Figure 9
Figure 9. Proposed role of the macrophage recombinatorial TCRαβ in the formation of the tuberculous granuloma and its regulatory interactions with TNF and CCL2.

References

    1. Janeway CA, Jr, Medzhitov R. Innate immune recognition. Annu Rev Immunol. 2002;20:197–216. - PubMed
    1. Glaziou P, Floyd K, Raviglione M. Global burden and epidemiology of tuberculosis. Clin Chest Med. 2009;30:621–636, vii. - PubMed
    1. Miller EA, Ernst JD. Illuminating the black box of TNF action in tuberculous granulomas. Immunity. 2008;29:175–177. - PubMed
    1. Kaufmann SH. Tuberculosis: back on the immunologists' agenda. Immunity. 2006;24:351–357. - PubMed
    1. Keane J, Gershon S, Wise RP, Mirabile-Levens E, Kasznica J, et al. Tuberculosis associated with infliximab, a tumor necrosis factor alpha-neutralizing agent. N Engl J Med. 2001;345:1098–1104. - PubMed

Publication types

MeSH terms

Substances

LinkOut - more resources