. 2011;6(11):e27808.
doi: 10.1371/journal.pone.0027808. Epub 2011 Nov 16.

Clinical and genetic determinants of warfarin pharmacokinetics and pharmacodynamics during treatment initiation

Affiliations

Clinical and genetic determinants of warfarin pharmacokinetics and pharmacodynamics during treatment initiation

Inna Y Gong et al. PLoS One. 2011.

Abstract

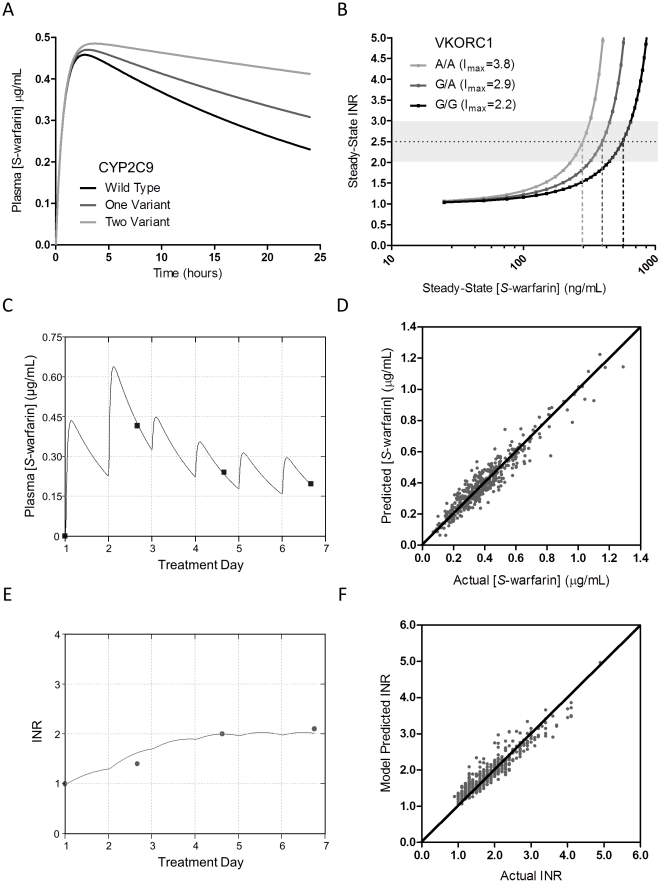
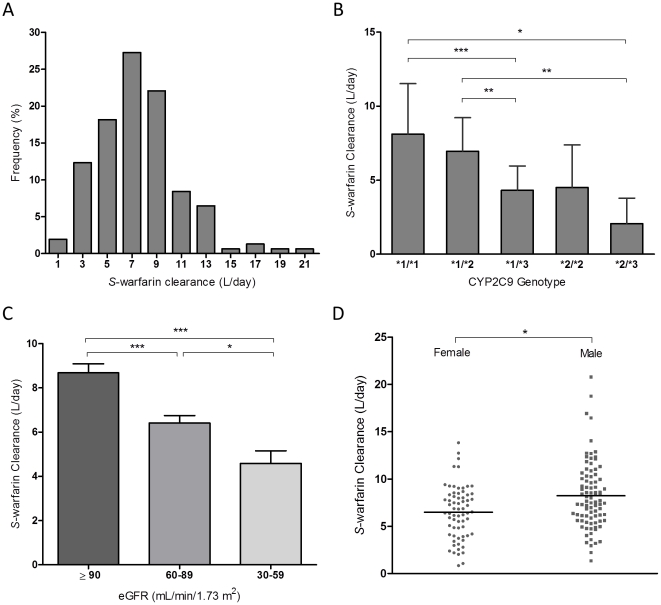
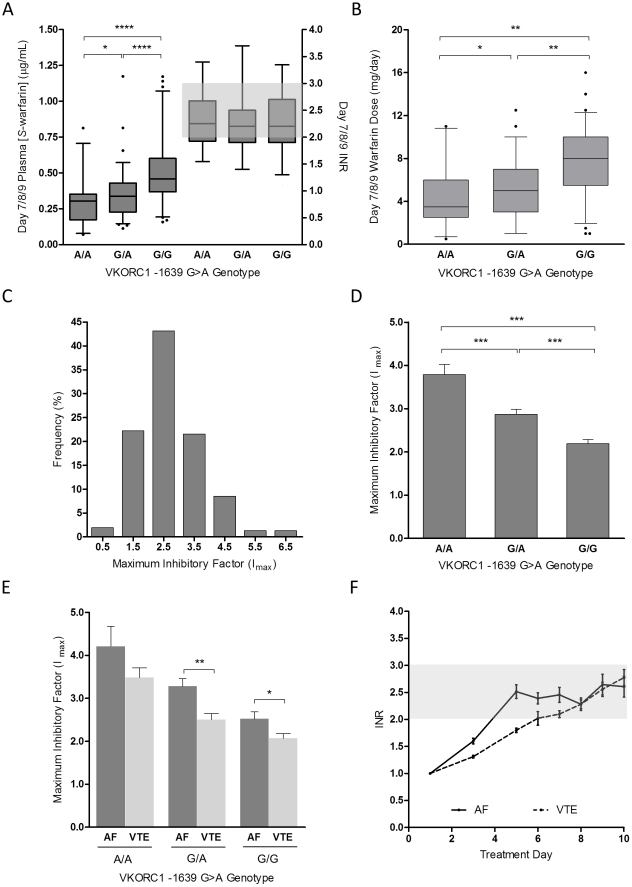
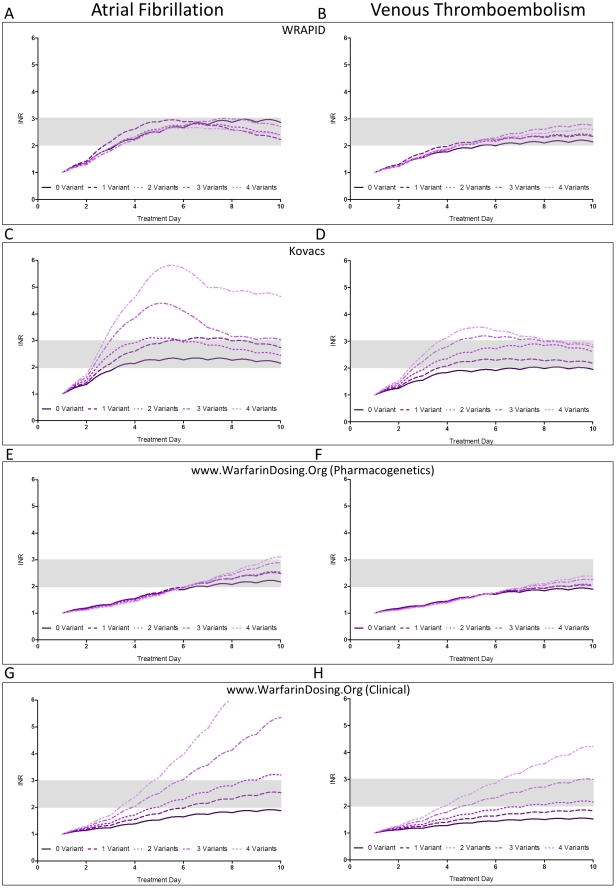
Variable warfarin response during treatment initiation poses a significant challenge to providing optimal anticoagulation therapy. We investigated the determinants of initial warfarin response in a cohort of 167 patients. During the first nine days of treatment with pharmacogenetics-guided dosing, S-warfarin plasma levels and international normalized ratio were obtained to serve as inputs to a pharmacokinetic-pharmacodynamic (PK-PD) model. Individual PK (S-warfarin clearance) and PD (I(max)) parameter values were estimated. Regression analysis demonstrated that CYP2C9 genotype, kidney function, and gender were independent determinants of S-warfarin clearance. The values for I(max) were dependent on VKORC1 and CYP4F2 genotypes, vitamin K status (as measured by plasma concentrations of proteins induced by vitamin K absence, PIVKA-II) and weight. Importantly, indication for warfarin was a major independent determinant of I(max) during initiation, where PD sensitivity was greater in atrial fibrillation than venous thromboembolism. To demonstrate the utility of the global PK-PD model, we compared the predicted initial anticoagulation responses with previously established warfarin dosing algorithms. These insights and modeling approaches have application to personalized warfarin therapy.


Conflict of interest statement

Competing Interests: The authors have declared that no competing interests exist.

Figures

Figure 1
Figure 1. PK-PD model performance.
(A) Model simulated S-warfarin plasma concentration-time profiles after single dose with CYP2C9 variant alleles. (B) Model simulated steady-state therapeutic INR (2.5) vs. S-warfarin plasma concentration with varying Imax corresponding to VKORC1 -1639G>A genotype. (C) Model fit of measured S-warfarin concentrations in a single patient. (D) Scatter plot of actual vs. predicted S-warfarin plasma concentration throughout the initiation phase (coefficient of determination, r2 = 0.91, n = 459). The diagonal line represents the unity line. (E) Model fit of measured anticoagulation INR response values in the same patient as in (C). (F) Scatter plot of actual vs. predicted INR during the initiation phase (r2 = 0.89, n = 459). The diagonal line represents the unity line. Imax, maximal inhibitory factor; INR, international normalized ratio.
Figure 2
Figure 2. Determinants of S-warfarin clearance.
(A) Frequency distribution of estimated S-warfarin clearance, shown as percent of total patients for each bin. (B) Relationship between CYP2C9 genotype and S-warfarin clearance. Lines represent mean clearance. (C) S-warfarin clearance is significantly correlated with kidney function, as defined by eGFR. (D) Observed S-warfarin clearance segregated by gender. Lines represent mean clearance. eGFR, estimated glomerular filtration rate. * P<0.05, ** P<0.005, ***P<0.0005
Figure 3
Figure 3. Determinants of maximal inhibitory factor, Imax.
(A) Box-and-whisker plots of S-warfarin plasma concentration and INR on days 7/8/9 segregated by VKORC1 -1639G>A genotype. Box-and-whisker plots representing VKORC1 gene-dose effect during initiation. The top and bottom of the boxes represents 25th and 75th percentile, respectively; median is represented by the middle line, whiskers are the 95% CI, and outliers are identified as closed circles. (B) Warfarin daily dose on days 7/8/9 with respect to VKORC1 genotype. (C) Frequency distribution of estimated Imax, shown as percent of total patients for each bin. (D) Association between VKORC1 genotype and Imax. Results are represented as mean with standard deviation. (E) Additive effect of indication for warfarin therapy and VKORC1 genotype on Imax. (F) INR time course for patients with AF and VTE over the initial 10 days of therapy with common genetics-guided dosing protocol. Results are represented as mean with 95% CI of the standard error. AF, atrial fibrillation; INR, international normalized ratio; VTE, venous thromboembolism. * P<0.05, ** P<0.01, *** P<0.001, **** P<0.0001.
Figure 4
Figure 4. The influence of VKORC1 -1639G>A promoter genotype on hepatic VKOR protein expression levels.
(A, B, C) VKOR expression determined in 17 healthy human livers by Western blot analysis. The band intensity was normalized to HLM100. A positive control sample was included on each blot. (D) Semiquantitative measurement of hepatic expression in relation to VKORC1 genotype. * P<0.01
Figure 5
Figure 5. Model predicted response curves following warfarin initiation using various initiation protocols.
Simulations were performed using non-genetics and genetics-based nomograms for typical AF and VTE patients harbouring variable number of variant alleles. The genotype of zero-variant patients is VKORC1G/G-CYP2C9 *1/*1. Patients carrying 1 variant allele have one of the following genotype combinations: VKORC1G/A-CYP2C9 *1/*1, VKORC1G/G-CYP2C9 *1/*2, or VKORC1G/G-CYP2C9 *1/*3. Patients carrying 2 variant alleles have one of the following genotype combinations: VKORC1A/A-CYP2C9 *1/*1, VKORC1G/A-CYP2C9 *1/*2, VKORC1G/A-CYP2C9 *1/*3, or VKORC1G/G-CYP2C9 *2/*2. Patients carrying 3 variant alleles have one of the following genotype combinations: VKORC1A/A-CYP2C9 *1/*2, VKORC1A/A-CYP2C9 *1/*3, VKORC1G/A-CYP2C9 *2/*2, or VKORC1G/A-CYP2C9 *2/*3. Patients carrying 4 variant alleles have one of the following genotype combinations: VKORC1A/A-CYP2C9 *2/*2, or VKORC1A/A-CYP2C9 *2/*3. AF, atrial fibrillation; VTE, venous thromboembolism.

References

    1. Ansell J, Hirsh J, Hylek E, Jacobson A, Crowther M, et al. Pharmacology and management of the vitamin K antagonists: American College of Chest Physicians Evidence-Based Clinical Practice Guidelines (8th Edition). Chest. 2008;133:160S–198S. - PubMed
    1. Landefeld CS, Beyth RJ. Anticoagulant-related bleeding: clinical epidemiology, prediction, and prevention. Am J Med. 1993;95:315–328. - PubMed
    1. Fasco MJ, Principe LM. R- and S-Warfarin inhibition of vitamin K and vitamin K 2,3-epoxide reductase activities in the rat. J Biol Chem. 1982;257:4894–4901. - PubMed
    1. Kaminsky LS, Zhang ZY. Human P450 metabolism of warfarin. Pharmacol Ther. 1997;73:67–74. - PubMed
    1. Wadelius M, Chen LY, Eriksson N, Bumpstead S, Ghori J, et al. Association of warfarin dose with genes involved in its action and metabolism. Hum Genet. 2007;121:23–34. - PMC - PubMed

Publication types

MeSH terms