

Mammographic density and breast cancer risk: current understanding and future prospects
- PMID: 22114898
- PMCID: PMC3326547
- DOI: 10.1186/bcr2942
Mammographic density and breast cancer risk: current understanding and future prospects
Abstract
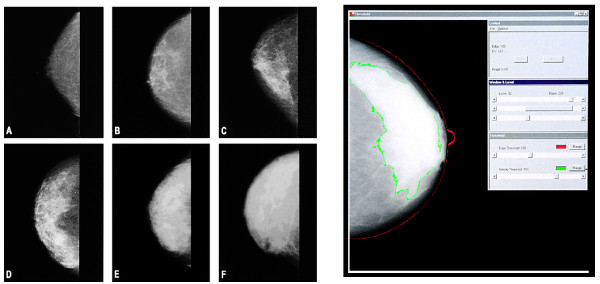
Variations in percent mammographic density (PMD) reflect variations in the amounts of collagen and number of epithelial and non-epithelial cells in the breast. Extensive PMD is associated with a markedly increased risk of invasive breast cancer. The PMD phenotype is important in the context of breast cancer prevention because extensive PMD is common in the population, is strongly associated with risk of the disease, and, unlike most breast cancer risk factors, can be changed. Work now in progress makes it likely that measurement of PMD will be improved in the near future and that understanding of the genetics and biological basis of the association of PMD with breast cancer risk will also improve. Future prospects for the application of PMD include mammographic screening, risk prediction in individuals, breast cancer prevention research, and clinical decision making.
Figures
References
-
- McCormack VA, dos Santos Silva I. Breast density and parenchymal patterns as markers of breast cancer risk: a meta-analysis. Cancer Epidemiol Biomarkers Prev. 2006;15:1159–1169. - PubMed
-
- Johns PC, Yaffe MJ. X-ray characterisation of normal and neoplastic breast tissues. Phys Med Biol. 1987;32:675–695. - PubMed
-
- Wolfe JN. Risk for breast cancer development determined by mammographic parenchymal pattern. Cancer. 1976;37:2486–2492. - PubMed
-
- Wolfe JN. Breast patterns as an index of risk for developing breast cancer. AJR Am J Roentgenol. 1976;126:1130–1139. - PubMed
Publication types
MeSH terms
LinkOut - more resources
Full Text Sources
Other Literature Sources
Medical
