. 2011 Dec;50(12):1275-89.e2.
doi: 10.1016/j.jaac.2011.09.023. Epub 2011 Nov 16.

Differential patterns of abnormal activity and connectivity in the amygdala-prefrontal circuitry in bipolar-I and bipolar-NOS youth

Affiliations

Differential patterns of abnormal activity and connectivity in the amygdala-prefrontal circuitry in bipolar-I and bipolar-NOS youth

Cecile D Ladouceur et al. J Am Acad Child Adolesc Psychiatry. 2011 Dec.

Abstract

Objective: The functioning of neural systems supporting emotion processing and regulation in youth with bipolar disorder not otherwise specified (BP-NOS) remains poorly understood. We sought to examine patterns of activity and connectivity in youth with BP-NOS relative to youth with bipolar disorder type I (BP-I) and healthy controls (HC).

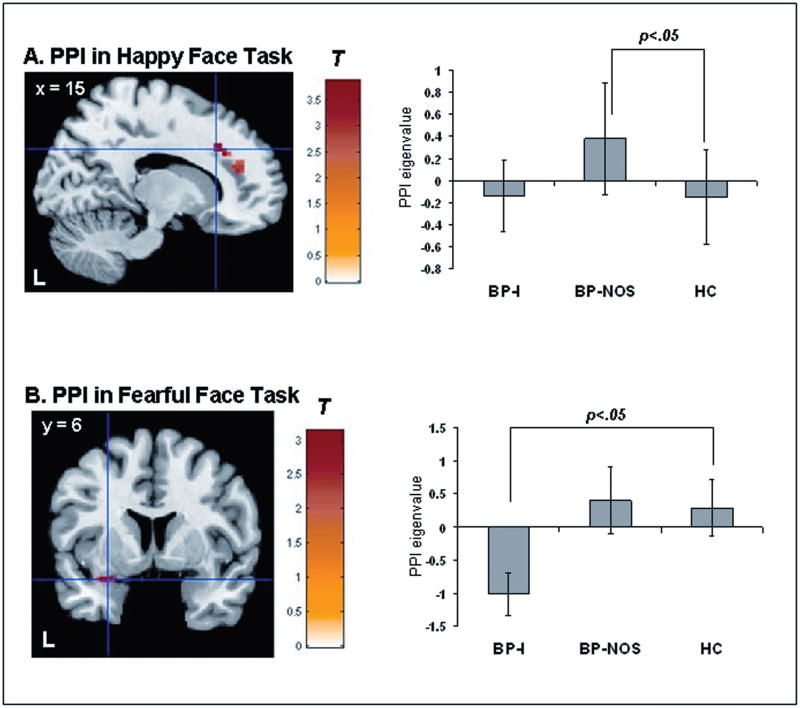
Method: Participants (18 BP-I youth, 16 BP-NOS youth, and 18 HC) underwent functional magnetic resonance imaging while performing two emotional-face gender labeling tasks (happy/neutral, fearful/neutral). Analyses focused on a priori neural regions supporting emotion processing (amygdala) and emotion regulation (ventromedial prefrontal cortex (VMPFC), dorsolateral prefrontal cortex (DLPFC). Connectivity analyses used VMPFC as a seed region.

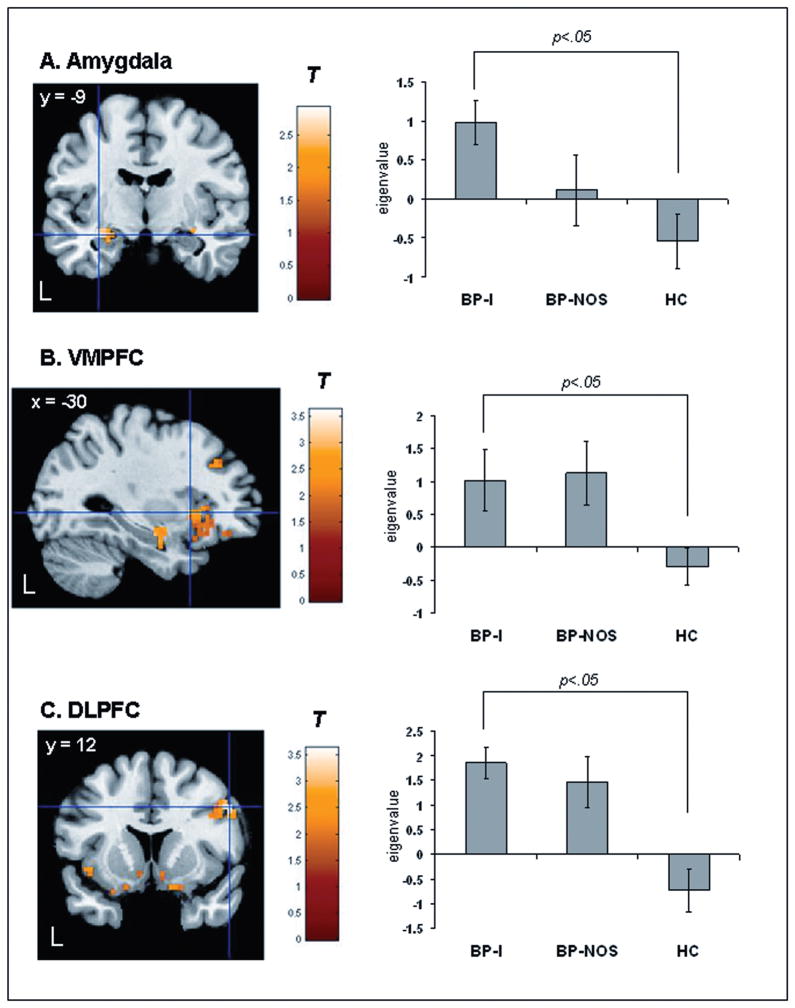
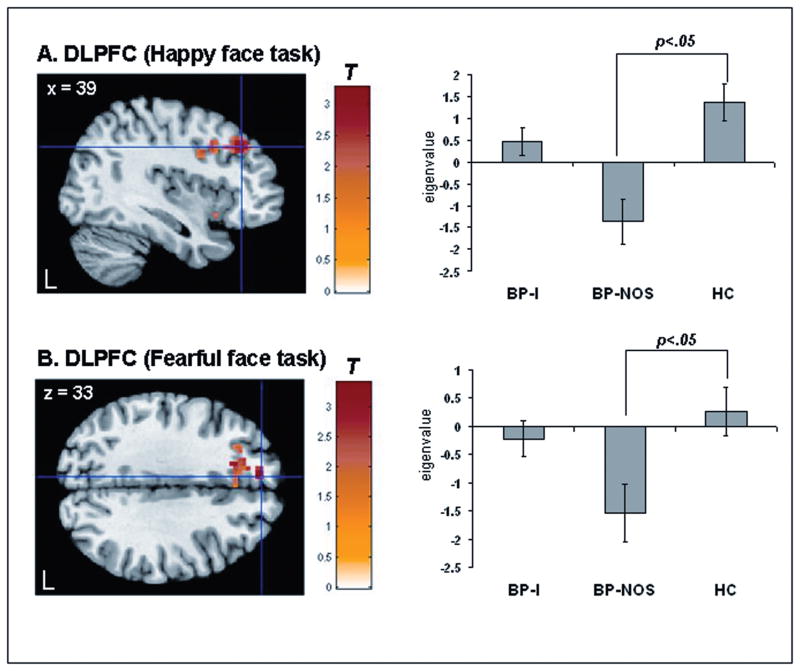
Results: During the happy-face task, BP-I youth had greater amygdala, VMPFC, and DLPFC activity to happy faces whereas BP-NOS youth had reduced VMPFC and DLPFC activity to neutral faces relative to HC, and reduced amygdala, VMPFC, and DLPFC activity to neutral faces versus BP-I. During the fearful-face task, BP-I youth had reduced DLPFC activity to fearful faces whereas BP-NOS youth had reduced DLPFC activity to neutral faces relative to HC. BP-NOS youth showed greater VMPFC-DLPFC connectivity to happy faces relative to HC and BP-I youth. BP-I youth showed reduced VMPFC-amygdala connectivity to fearful faces relative to HC and BP-NOS youth.

Conclusions: This is the first study to document differential patterns of abnormal neural activity in, and connectivity between, neural regions supporting emotion processing and regulation in BP-NOS versus BP-I youth. Findings suggest that despite similarities in symptom presentation, there are differential patterns of abnormal neural functioning in BP-NOS and BP-I relative to HC, which might reflect an "intermediate state" in the course of BP-I illness. Future longitudinal studies are needed to relate these findings with future conversion to BP-I/II.


Figures

Figure 1
Figure 1
Statistical parametric map displaying between-group contrasts for happy faces masked with the significant group x emotion condition interaction in the happy face task (left). Note: Histogram displaying mean eigenvalues extracted from the peak voxel of the cluster that reached statistical threshold (right). A. Bipolar Disorder Type I (BP-I) > healthy controls (HC) (left amygdala)[t(95)=2.93, p=.002, p<.05, corrected]. B. BP-I > HC (left ventromedial prefrontal cortex (VMPFC)) [t(95)=2.52, p=.007, p<.05 corrected]. There was a trend for Bipolar Disorder Not Otherwise Specified (BP-NOS)>HC (left VMPFC) [t(95)=2.45, p=.008, p<.10, corrected]. C. BP-I > HC (right dorsolateral prefrontal cortex (DLPFC)) [t(95)=3.63, p=<.001, p<.05, corrected]. Statistics and coordinates are given in Table 3. Color bars ranging from red to yellow represent T statistics. For display purposes, cluster threshold was set at 55 voxels. L = left.
Figure 2
Figure 2
Statistical parametric map displaying between-group contrasts for neutral faces masked with the corresponding significant group x emotion condition interaction statistical map (happy or fearful face task) (left). Note: Histogram displaying mean eigenvalues extracted from the peak voxel of the cluster that reached statistical threshold (right). A. Bipolar Disorder Not Otherwise Specified (BP-NOS)< healthy controls (HC) to neutral faces dorsolateral prefrontal cortex (DLPFC) [t(91)==3.24, p<.001, p<.05, corrected] masked with the significant group x emotion condition interaction statistical map in the happy face task. B. BP-NOS < HC to neutral faces (DLPFC) [t(91)=3.40, p<.001, p<.05, corrected] masked with the significant group x condition interaction statistical map in the fearful face task. Statistics and coordinates are given in Table 3. Color bars ranging from red to yellow represent T statistics. For display purposes, cluster threshold was set at 55 voxels. L = left.
Figure 3
Figure 3
A. Neural connectivity between bilateral ventromedial prefrontal cortex (VMPFC) and right dorsolateral prefrontal cortex (DLPFC) to happy faces. Note: Statistical parametric map (SPM-T) displaying a significant between-group contrast that was masked with the significant main effect of group statistical map (SPM-F), [F(2,95)=8.04, p<.001; p<.05, corrected, kE=93] (left). Relative to healthy controls (HC) (n=18), bipolar disorder not otherwise specified (BP-NOS) youth (n=16) showed significantly greater connectivity between ventromedial prefrontal cortex (VMPFC) and right dorsolateral prefrontal cortex (DLPFC) (Talairach x, y, z: 15, 25, 29) to happy faces, [t(95)=3.87, p<.001, p<.05, corrected], kE=93). B. Neural connectivity between bilateral VMPFC and left amygdala to fearful faces. SPM-T displaying a significant between-group contrast that was masked with the significant main effect of SPM-F, [F(2,91)=12.11, p<.001, p<.05, corrected, kE=19] (left). Relative to HC (n=18), BP-I youth (n=17) showed significantly reduced connectivity between VMPFC and left amygdala (Talairach x, y, z: −30, 2, −13) to fearful faces, [t(91)=3.13, p<.001, p<.05, corrected, kE=17]. For A and B, histograms on the right display mean eigenvalues extracted from the peak voxel of the cluster that reached statistical threshold (right). Color bars ranging from red to yellow represent T statistics. For display purposes, cluster threshold was set at 55 voxels. L = left; PPI = Psychophysiological Interaction.

Similar articles

Cited by

References

    1. Merikangas KR, Akiskal H, Angst J, et al. Lifetime and 12-month prevalence of bipolar spectrum disorder in the National Comorbidity Survey replication. Arch Gen Psychiatry. 2007;64:543–552. - PMC - PubMed
    1. Phillips ML, Drevets WC, Rauch SL, Lane R. Neurobiology of emotion perception II: Implications for major psychiatric disorders. Biol Psychiatry. 2003;54:515–528. - PubMed
    1. Charney DS, Babich KS. Foundation for the NIMH strategic plan for mood disorders research. Biol Psychiatry. 2002;52(6):455–456. - PubMed
    1. Phillips ML, Frank E. Redefining Bipolar Disorder: Toward DSM-V. Am J Psychiatry. 2006;163:1135–1136. - PubMed
    1. Phillips ML, Ladouceur CD, Drevets WC. A neural model of voluntary and automatic emotion regulation: implications for understanding the pathophysiology and neurodevelopment of bipolar disorder. Mol Psychiatry. 2008;13(9):829, 833–857. - PMC - PubMed

Publication types

MeSH terms