. 2012 Jan;40(2):e15.
doi: 10.1093/nar/gkr1071. Epub 2011 Nov 23.

MetaQC: objective quality control and inclusion/exclusion criteria for genomic meta-analysis

Affiliations

MetaQC: objective quality control and inclusion/exclusion criteria for genomic meta-analysis

Dongwan D Kang et al. Nucleic Acids Res. 2012 Jan.

Abstract

Genomic meta-analysis to combine relevant and homogeneous studies has been widely applied, but the quality control (QC) and objective inclusion/exclusion criteria have been largely overlooked. Currently, the inclusion/exclusion criteria mostly depend on ad-hoc expert opinion or naïve threshold by sample size or platform. There are pressing needs to develop a systematic QC methodology as the decision of study inclusion greatly impacts the final meta-analysis outcome. In this article, we propose six quantitative quality control measures, covering internal homogeneity of coexpression structure among studies, external consistency of coexpression pattern with pathway database, and accuracy and consistency of differentially expressed gene detection or enriched pathway identification. Each quality control index is defined as the minus log transformed P values from formal hypothesis testing. Principal component analysis biplots and a standardized mean rank are applied to assist visualization and decision. We applied the proposed method to 4 large-scale examples, combining 7 brain cancer, 9 prostate cancer, 8 idiopathic pulmonary fibrosis and 17 major depressive disorder studies, respectively. The identified problematic studies were further scrutinized for potential technical or biological causes of their lower quality to determine their exclusion from meta-analysis. The application and simulation results concluded a systematic quality assessment framework for genomic meta-analysis.


Figures

Figure 1.
Figure 1.
Example of IQC calculation and reverse transformation of PIQC. (A) Three points (E2, E3 and E4) in the lower left represent homogeneous studies, and a point (E1) in the upper right is a heterogeneous study which has larger pair-wise distance to others. A heterogeneous study should have larger pair-wise distances with others. The IQC hypothesis setting compares (d12,d13,d14) and (d23,d24,d34) by Wilcoxon rank-sum test. (B) X- and Y-axes are P-values before and after applying the reverse transformation g. As a result, small P-values will be transformed to large pseudo P-values and vice versa.
Figure 2.
Figure 2.
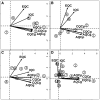
PCA biplots of QC measures in four examples. Each circled number represents the overall rank by SMR score of a study. Smaller numbers correspond to higher quality studies. (A) Seven brain cancer studies. (B) Nine prostate cancer studies. (C) Eight IPF studies. (D) Seventeen MDD studies.
Figure 3.
Figure 3.
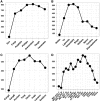
Marginal impacts on meta-analysis for DE genes detection. X-axis represents each study included cumulatively to a series of meta-analyses. The order of addition follows the SMR score in the Table 4. Y-axis represents the number of DE genes detected. (A) Brain cancer example under FDR = 0.5% threshold. (B) Prostate cancer example under FDR = 0.1% threshold. (C) IPF example under FDR = 0.1% threshold. (D) MDD example under P-value = 0.01 threshold.
Figure 4.
Figure 4.
Marginal impacts on meta-analysis for enriched pathway detection. Similar to Figure 3, X-axis represents each study included cumulatively to a series of meta-analyses. The order of addition follows the SMR score in the Table 4. Y-axis represents the number of pathways detected. All examples are shown under FDR = 5% threshold. (A) Brain cancer example. (B) Prostate cancer example. (C) IPF example. (D) MDD example.
Figure 5.
Figure 5.
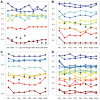
Simulations showing effects of adding an irrelevant ‘spike-in’ study. Y-axis represents the value of 1-SMR. Greater Y-axis values correspond to better quality studies judged by MetaQC. X-axis represents the addition of an irrelevant ‘spike-in’ study. A set of irrelvant studies were obtained from one of the other three examples. ‘NA’ represents the original quality result without the spike-in simulation which is the same result as Table 4. A black asterisk represents the 1-SMR of the added irrelevant study. (A) Brain cancer studies with a spiked-in prostate cancer study. (B) Prostate cancer studies with a spiked-in brain cancer study. (C) IPF studies with a spiked-in brain cancer study. (D) MDD studies with a spiked-in brain cancer study.

References

    1. Edgar R, Domrachev M, Lash AE. Gene Expression Omnibus: NCBI gene expression and hybridization array data repository. Nucleic Acids Res. 2002;30:207. - PMC - PubMed
    1. Parkinson H, Sarkans U, Shojatalab M, Abeygunawardena N, Contrino S, Coulson R, Farne A, Garcia Lara G, Holloway E, Kapushesky M, et al. ArrayExpress-a public repository for microarray gene expression data at the EBI. Nucleic Acids Res. 2005;33:D553. - PMC - PubMed
    1. Sherlock G, Hernandez-Boussard T, Kasarskis A, Binkley G, Matese JC, Dwight SS, Kaloper M, Weng S, Jin H, Ball CA, et al. The Stanford microarray database. Nucleic Acids Res. 2001;29:152. - PMC - PubMed
    1. Draghici S, Khatri P, Eklund AC, Szallasi Z. Reliability and reproducibility issues in DNA microarray measurements. TRENDS Genet. 2006;22:101–109. - PMC - PubMed
    1. Ein-Dor L, Kela I, Getz G, Givol D, Domany E. Outcome signature genes in breast cancer: is there a unique set? Bioinformatics. 2005;21:171. - PubMed

Publication types