. 2012 Mar 15;302(6):C839-52.
doi: 10.1152/ajpcell.00361.2011. Epub 2011 Nov 23.

Assessment of cellular mechanisms contributing to cAMP compartmentalization in pulmonary microvascular endothelial cells

Affiliations

Assessment of cellular mechanisms contributing to cAMP compartmentalization in pulmonary microvascular endothelial cells

Wei P Feinstein et al. Am J Physiol Cell Physiol. .

Abstract

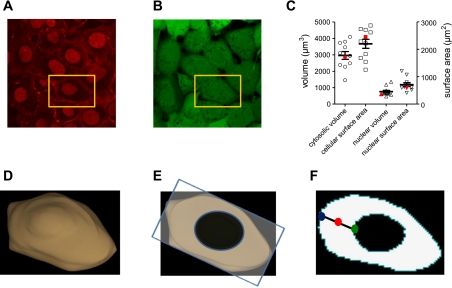
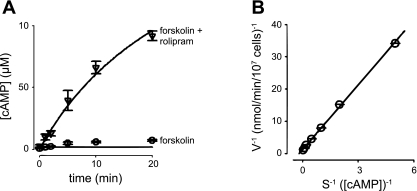
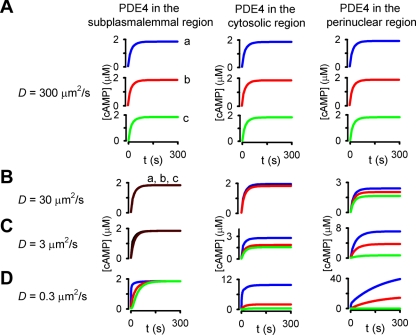
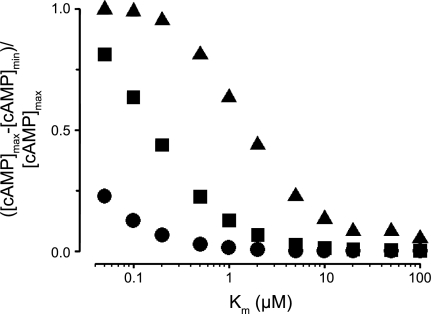
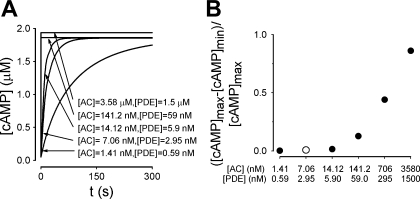
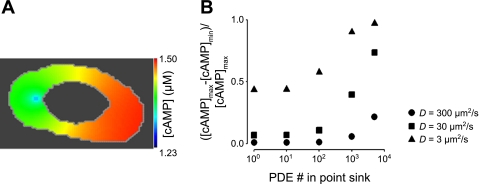
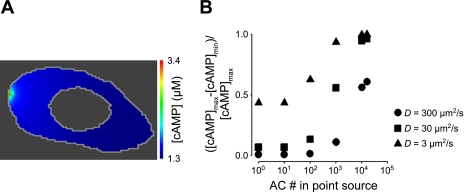
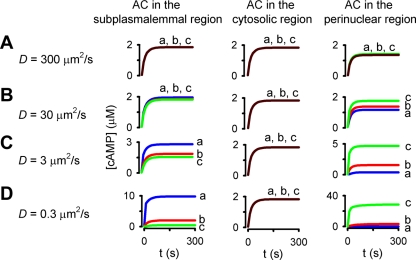
Cyclic AMP signals encode information required to differentially regulate a wide variety of cellular responses; yet it is not well understood how information is encrypted within these signals. An emerging concept is that compartmentalization underlies specificity within the cAMP signaling pathway. This concept is based on a series of observations indicating that cAMP levels are distinct in different regions of the cell. One such observation is that cAMP production at the plasma membrane increases pulmonary microvascular endothelial barrier integrity, whereas cAMP production in the cytosol disrupts barrier integrity. To better understand how cAMP signals might be compartmentalized, we have developed mathematical models in which cellular geometry as well as total adenylyl cyclase and phosphodiesterase activities were constrained to approximate values measured in pulmonary microvascular endothelial cells. These simulations suggest that the subcellular localizations of adenylyl cyclase and phosphodiesterase activities are by themselves insufficient to generate physiologically relevant cAMP gradients. Thus, the assembly of adenylyl cyclase, phosphodiesterase, and protein kinase A onto protein scaffolds is by itself unlikely to ensure signal specificity. Rather, our simulations suggest that reductions in the effective cAMP diffusion coefficient may facilitate the formation of substantial cAMP gradients. We conclude that reductions in the effective rate of cAMP diffusion due to buffers, structural impediments, and local changes in viscosity greatly facilitate the ability of signaling complexes to impart specificity within the cAMP signaling pathway.


Figures

Fig. 1.
Fig. 1.
Geometry of cultured pulmonary microvascular endothelial cells (PMVECs). Geometries were based on measurements of a series of slices (z-stacks, confocal microscopy). A: wheat agglutinin Alexa Fluor 647 and DRAQ5 were used to label plasma membranes and nuclei of confluent PMVEC monolayers. B: calcein green was used to label the intracellular space. C: the distribution of dimensions for individual PMVECs. Cytosolic volume was estimated as the intracellular volume minus the nuclear volume. D: three-dimensional geometry of the cultured PMVEC used in subsequent simulations (cell indicated by gold rectangle in A). This cell had average volume, surface area, nuclear volume, and nuclear surface area (indicated in red symbols in C). E: an individual slice through this cell from which results of subsequent simulations are displayed. All simulations were run in three dimensions. F: to simplify the representation of four-dimensional data, we present the time course of cAMP signals at three distinct subcellular locations within the plane depicted in E: at the plasma membrane, within the cytosol, and in the perinuclear space, indicated by the blue, red, and green circles, respectively.
Fig. 2.
Fig. 2.
cAMP accumulation and phosphodiesterase (PDE) activity in PMVECs. A: time course of intracellular cAMP accumulation triggered by addition of 10 μM forskolin following 10 min of pretreatment with vehicle (○) or 10 μM rolipram (a PDE4 inhibitor, ▿). The basic model used to describe the spatial spread of cAMP (solid line) adequately fits overall cAMP accumulation. Simulations including cAMP buffers better fit the time course of cAMP accumulation in the absence of rolipram (not shown). B: cAMP PDE activity measured in PMVECs as described in materials and methods (○). Solid lines represent curve fits to data. On the basis of the fits, Km and Vmax of PDE activity were estimated to be 4.5 μM and 0.71 nmol·min−1·10−7 cells. Data are presented as means ± SE.
Fig. 3.
Fig. 3.
Simulations depicting the effects of subcellular PDE distribution on spatial spread of cAMP signals. The time course of agonist-induced cAMP accumulation at three subcellular locations, the plasma membrane (blue line, a), the cytosol (red line, b), and the perinuclear region (green line, c), as depicted in Fig. 1F, is shown. In these simulations, adenylyl cyclase (AC) activity was uniformly distributed along the plasma membrane; PDE activity was distributed uniformly in either the subplasmalemmal, cytosolic, or perinuclear regions (left, center, and right columns, respectively); and the effective cAMP diffusion coefficient (D) was 300, 30, 3, and 0.3 μm2/s (A, B, C, and D, respectively). Decreasing the effective cAMP diffusion coefficient D from 300 to 0.3 μm2/s facilitated the formation of cAMP gradients regardless of the subcellular distribution of PDEs.
Fig. 4.
Fig. 4.
Decreased Km of PDE activity potentiates formation of cAMP gradients. Normalized differences between maximum and minimum cAMP levels ([cAMP]max and [cAMP]min) from simulations with effective cAMP diffusion coefficients of 300 (●), 30 (■), and 3 μm2/s (▴) are shown. Simulations were evaluated at 5 min following activation of AC. PDE and AC activities were uniformly distributed within the cytosol and along the plasma membrane, respectively. Km values for PDE4, the predominant PDE isoform in PMVECs, were typically between 1 and 5 μM.
Fig. 5.
Fig. 5.
Effects of increasing AC and PDE activities on cAMP signals. A: the kinetics of total cellular cAMP accumulation become faster as the levels of AC and PDE activities are increased. B: normalized differences between maximum and minimum cAMP levels within the cell determined 5 min following activation of AC. The open circle depicts estimated AC and PDE activities from cultured PMVECs. In these simulations, AC activity was uniformly distributed along the plasma membrane, PDE activity was distributed throughout the cytosol, and the effective cAMP diffusion coefficient was 300 μm2/s. AC and PDE activities are as indicated.
Fig. 6.
Fig. 6.
Effects of localized PDE activity on cAMP gradients. In these simulations a subset of PDE activity was concentrated at a specific subcellular location (a point sink) while total cellular PDE activity remained constant. For example, if 100 PDEs were localized within the point source, then 4,900 PDEs were uniformly distributed within the cytosol; if 1,000 PDEs were localized to a single location, then 4,000 were uniformly distributed within the cytosol. AC activity was evenly distributed along the plasma membrane. A: simulated distribution of cAMP within a PMVEC when the total cellular PDE activity (295 nM/s) was sequestered into one location. D = 300 μm2/s. B: effects of increasing localized PDE activity (while total cellular PDE activity remained constant) on normalized differences between maximum and minimum cAMP levels at effective cAMP diffusion coefficients of 300 (●), 30 (■), and 3 μm2/s (▴). Simulations were evaluated 5 min following AC activation. Minimum cAMP levels for simulations run at each effective diffusion coefficient (t = 5 min) were as follows: D = 300 μm2/s: 1.36 ≤ [cAMP]min ≤ 1.41 μM; D = 30 μm2/s: 1.02 ≤ [cAMP]min ≤ 1.38 μM; D = 3 μm2/s: 0.26 ≤ [cAMP]min ≤ 1.16 μM.
Fig. 7.
Fig. 7.
Effect of localized AC activity on the spatial spread of cAMP signals. AC activity was concentrated within a single location on the plasma membrane while total cellular AC activity remained constant. PDE activity was evenly distributed throughout the cytosol. A: the spatial distribution of cAMP signals 5 min following activation of AC. Total cellular AC activity (141.2 nM/s) was sequestered at one location. D = 300 μm2/s. B: effect of increasing localized AC activity on normalized differences between maximum and minimum cAMP levels with effective cAMP diffusion coefficients of 300 (●), 30 (■), and 3 (▴) μm2/s. Minimum cAMP levels for simulations run at each effective diffusion coefficient (time, t, = 5 min) were as follows: D = 300 μm2/s, 1.33 ≤ [cAMP]min ≤ 1.41 μM; D = 30 μm2/s: 0.96 ≤ [cAMP]min ≤ 1.38 μM; D = 3 μm2/s: 0.033 ≤ [cAMP]min ≤ 1.16 μM.
Fig. 8.
Fig. 8.
Simulations depicting the effects of subcellular AC distribution on spatial spread of cAMP signals. The time course of agonist-induced cAMP accumulation at three subcellular locations, the plasma membrane (blue line, a), the cytosol (red line, b), and the perinuclear region (green line, c), as depicted in Fig. 1F, is shown. In these simulations, AC activity was uniformly distributed along the plasma membrane, within the cytosol, or in the perinuclear region (left, center, and right columns, respectively); PDE activity was distributed uniformly in the cytosol; and the effective cAMP diffusion coefficient was 300, 30, 3, and 0.3 μm2/s (A, B, C, and D, respectively). Decreasing the effective cAMP diffusion coefficient D from 300 to 0.3 μm2/s facilitated the formation of cAMP gradients when AC activity was located at the plasma membrane or in the perinuclear region.
Fig. 9.
Fig. 9.
Effect of cAMP buffering on the spatial spread of cAMP signals. Normalized differences between maximum and minimum cAMP levels were evaluated in simulations that included cAMP buffering proteins, with KD = 460 nM (●) or KD = 100 nM (□). Buffering proteins were fixed and uniformly distributed within the cytosol. A: cAMP differences occurring when AC activity was uniformly distributed along the plasma membrane. B: cAMP differences occurring when AC activity was localized to a discrete location. PDE activity was evenly distributed in the cytosol, and the effective diffusion coefficient was 300 μm2/s. Simulations were evaluated 1 min following AC activation.
Fig. 10.
Fig. 10.
Time course of cAMP signals at different subcellular locations in different cellular geometries. A: cellular geometries and two-dimensional slice from a spherical cell (first column), a cultured PMVEC (second column), an idealized pulmonary endothelial cell (third column), and an enlarged endothelial cell that has a similar volume to a cultured PMVEC (fourth column). Surface area to volume (S/V) ratios are as indicated. The gray region in the idealized pulmonary endothelial cell (third column) represents the location of a 30 nm thick region within the cell. This exquisitely thin region represents observed changes in endothelial cell thickness in ex vivo preparations (30). BE: time course of cAMP accumulation at three subcellular locations [a (plasma membrane), b (cytosol), and c (perinuclear); blue, red, green lines, respectively] in simulations in which the effective cAMP diffusion coefficient was set to 300 (B), 30 (C), 3 (D), and 0.3 (E) μm2/s.
Fig. 11.
Fig. 11.
Effects of altering the effective cAMP diffusion coefficient on a plausible model of cAMP signaling in PMVECs. Simulations are analogous to those presented in Fig. 10: simulations of a cell in which 12,000 ACs were sequestered into 100 locations at the plasma membrane. PDE activity was distributed at the plasma membrane (30%), within the cytosol (50%), and in the perinuclear space (20%). A total of 1 μM of a fixed buffer (KD = 100 nM) was present in the cell. AD: the effective diffusion coefficient was varied from 300 to 0.3 μm2/s as indicated. The right column depicts simulations in which 10 μM rolipram (a PDE4 inhibitor with Ki = 0.1 μM) was present.
Fig. 12.
Fig. 12.
Plausible description of the spatial spread of cAMP signals in PMVECs. A and C: simulations of a cell in which a total of 12,000 ACs were sequestered into 100 locations at the plasma membrane. PDE activity was distributed at the plasma membrane (30%; a), within the cytosol (50%; b), and in the perinuclear space (20%; c). A total of 1 μM of a fixed buffer (KD = 100 nM) was present in the cell, and the effective diffusion coefficient was 2 μm2/s. Under these conditions, activation of AC initiated the generation of substantial cAMP gradients. B and D: simulations depicting the effects of treatment with 10 μM of a PDE inhibitor with a Ki of 0.1 μM (e.g., rolipram). Pretreatment with a PDE inhibitor allowed cAMP to accumulate throughout the cell. The spatial spread of cAMP 5 min following activation of AC is depicted in C and D.

Comment in

Similar articles

Cited by

References

    1. Abi-Gerges A, Richter W, Lefebvre F, Mateo P, Varin A, Heymes C, Samuel JL, Lugnier C, Conti M, Fischmeister R, Vandecasteele G. Decreased expression and activity of cAMP phosphodiesterases in cardiac hypertrophy and its impact on beta-adrenergic cAMP signals. Circ Res 105: 784–792, 2009 - PMC - PubMed
    1. Allbritton NL, Meyer T, Stryer L. Range of messenger action of calcium ion and inositol 1,4,5-trisphosphate. Science 258: 1812–1815, 1992 - PubMed
    1. Anderson RG, Jacobson K. a role for lipid shells in targeting proteins to caveolae, rafts, and other lipid domains. Science 296: 1821–1825, 2002 - PubMed
    1. Ariga M, Neitzert B, Nakae S, Mottin G, Bertrand C, Pruniaux MP, Jin SL, Conti M. Nonredundant function of phosphodiesterases 4D and 4B in neutrophil recruitment to the site of inflammation. J Immunol 173: 7531–7538, 2004 - PubMed
    1. Arnon A, Hamlyn JM, Blaustein MP. Ouabain augments Ca2+ transients in arterial smooth muscle without raising cytosolic Na+. Am J Physiol Heart Circ Physiol 279: H679–H691, 2000 - PubMed

Publication types

LinkOut - more resources