

The maturational trajectories of NREM and REM sleep durations differ across adolescence on both school-night and extended sleep
- PMID: 22116514
- PMCID: PMC3311517
- DOI: 10.1152/ajpregu.00532.2011
The maturational trajectories of NREM and REM sleep durations differ across adolescence on both school-night and extended sleep
Abstract
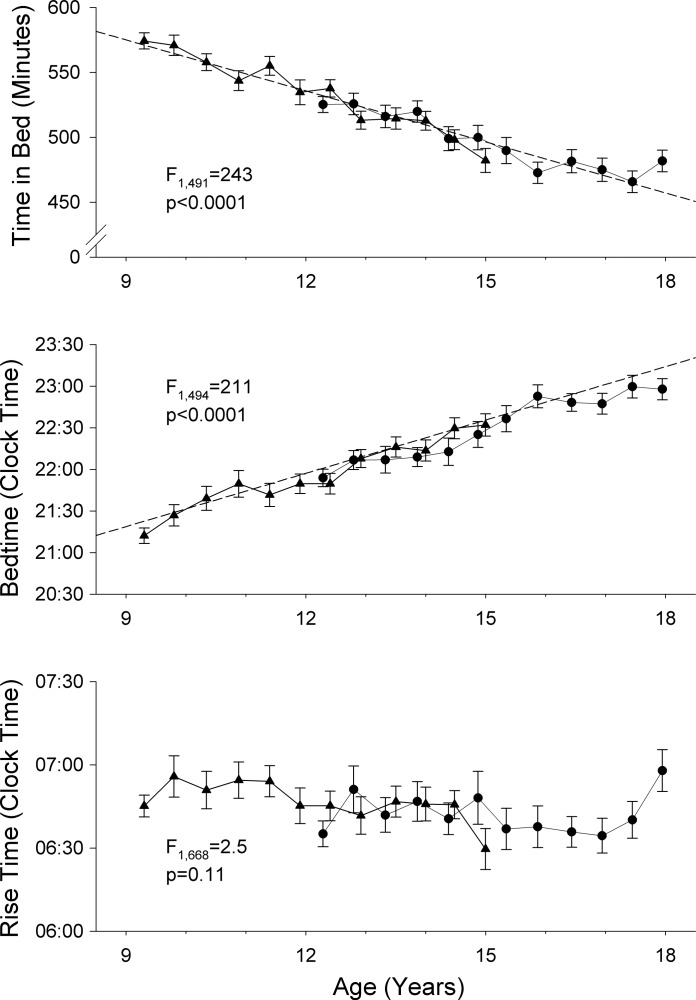
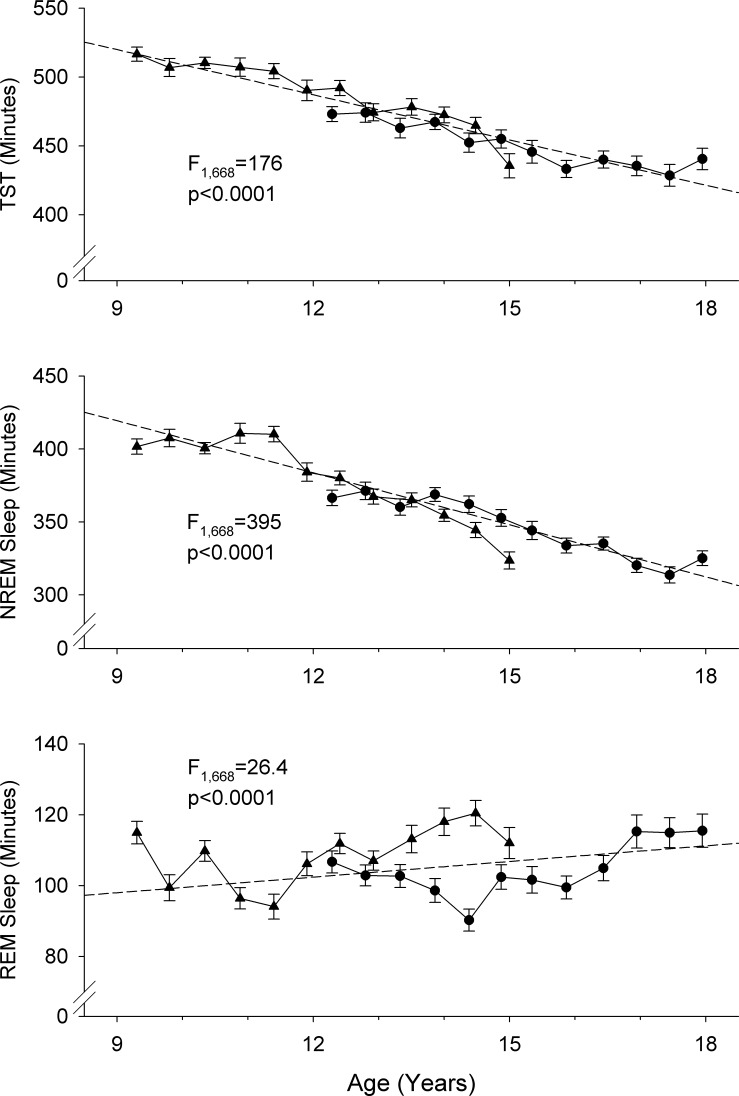
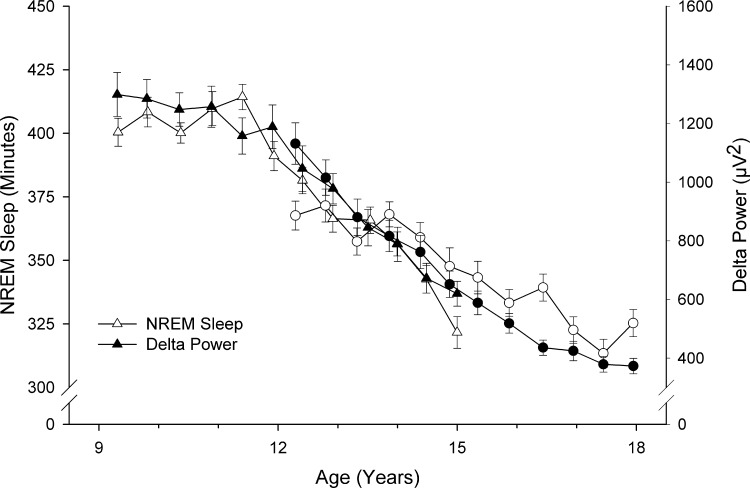
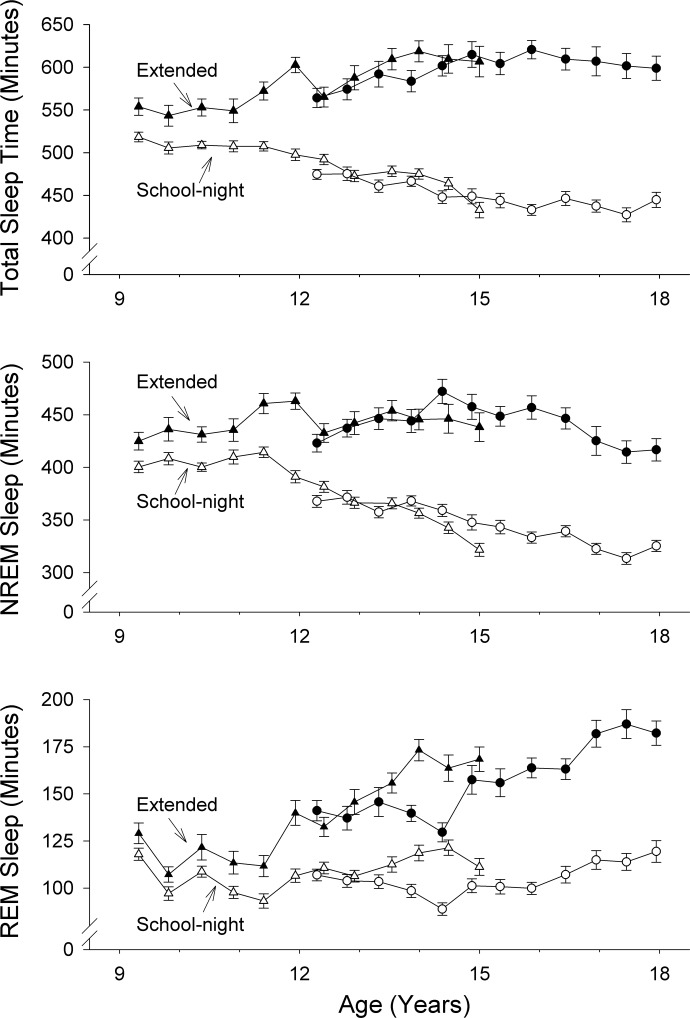
We recorded sleep electroencephalogram longitudinally across ages 9-18 yr in subjects sleeping at home. Recordings were made twice yearly on 4 consecutive nights: 2 nights with the subjects maintaining their ongoing school-night schedules, and 2 nights with time in bed extended to 12 h. As expected, school-night total sleep time declined with age. This decline was entirely produced by decreasing non-rapid eye movement (NREM) sleep. Rapid eye movement (REM) sleep durations increased slightly but significantly. NREM and REM sleep durations also exhibited different age trajectories when sleep was extended. Both durations exceeded those on school-night schedules. However, the elevated NREM duration did not change with age, whereas REM durations increased significantly. We interpret the adolescent decline in school-night NREM duration in relation to our hypothesis that NREM sleep reverses changes produced in plastic brain systems during waking. The "substrate" produced during waking declines across adolescence, because synaptic elimination decreases the intensity (metabolic rate) of waking brain activity. Declining substrate reduces both NREM intensity (i.e., delta power) and NREM duration. The absence of a decline in REM sleep duration on school-night sleep and its age-dependent increase in extended sleep pose new challenges to understanding its physiological role. Whatever their ultimate explanation, these robust findings demonstrate that the two physiological states of human sleep respond differently to the maturational brain changes of adolescence. Understanding these differences should shed new light on both brain development and the functions of sleep.
Figures
Comment in
-
Editorial focus: Sleep need in adolescence. Focus on: "The maturational trajectories of NREM and REM sleep durations differ across adolescence on both school-night and extended sleep.".Am J Physiol Regul Integr Comp Physiol. 2012 Mar 1;302(5):R531-2. doi: 10.1152/ajpregu.00692.2011. Epub 2012 Jan 18. Am J Physiol Regul Integr Comp Physiol. 2012. PMID: 22262305 No abstract available.
References
-
- Aserinsky E. The maximal capacity for sleep: rapid eye movement density as an index of sleep satiety. Biol Psychiatry 1: 147–159, 1969 - PubMed
-
- Borbély AA. A two process model of sleep regulation. Hum Neurobiol 1: 195–204, 1982 - PubMed
-
- Buchsbaum MS, Gillin JC, Wu J, Hazlett E, Sicoote N, Dupont RM, Bunny WE., Jr Regional cerebral glucose metabolic rate in human sleep assessed by positron emission tomography. Life Sci 45: 1349–1356, 1989 - PubMed
Publication types
MeSH terms
Grants and funding
LinkOut - more resources
Full Text Sources
Medical