Exploiting time in electronic health record correlations
- PMID: 22116643
- PMCID: PMC3241180
- DOI: 10.1136/amiajnl-2011-000463
Exploiting time in electronic health record correlations
Abstract
Objective: To demonstrate that a large, heterogeneous clinical database can reveal fine temporal patterns in clinical associations; to illustrate several types of associations; and to ascertain the value of exploiting time.
Materials and methods: Lagged linear correlation was calculated between seven clinical laboratory values and 30 clinical concepts extracted from resident signout notes from a 22-year, 3-million-patient database of electronic health records. Time points were interpolated, and patients were normalized to reduce inter-patient effects.
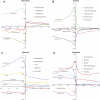
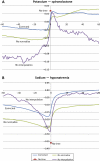
Results: The method revealed several types of associations with detailed temporal patterns. Definitional associations included low blood potassium preceding 'hypokalemia.' Low potassium preceding the drug spironolactone with high potassium following spironolactone exemplified intentional and physiologic associations, respectively. Counterintuitive results such as the fact that diseases appeared to follow their effects may be due to the workflow of healthcare, in which clinical findings precede the clinician's diagnosis of a disease even though the disease actually preceded the findings. Fully exploiting time by interpolating time points produced less noisy results.
Discussion: Electronic health records are not direct reflections of the patient state, but rather reflections of the healthcare process and the recording process. With proper techniques and understanding, and with proper incorporation of time, interpretable associations can be derived from a large clinical database.
Conclusion: A large, heterogeneous clinical database can reveal clinical associations, time is an important feature, and care must be taken to interpret the results.
Conflict of interest statement
Figures


References
-
- Blumenthal D, Tavenner M. The “meaningful use” regulation for electronic health records. N Engl J Med 2010;363:501–4 - PubMed
-
- Friedman CP, Wong AK, Blumenthal D. Achieving a nationwide learning health system. Sci Transl Med 2010;2:57cm29 - PubMed
-
- Bellazzi R, Larizza C, Magni P, et al. Intelligent analysis of clinical time series: an application in the diabetes mellitus domain. Artif Intell Med 2000;20:37–57 - PubMed
-
- Sacchi L, Larizza C, Combi C, et al. Data mining with temporal abstractions: learning rules from time series. Data Min Knowl Discov 2007;15:217–47
-
- Allen JF. Maintaining knowledge about temporal intervals. Commun ACM 1983;26:832–43
Publication types
MeSH terms
Grants and funding
LinkOut - more resources
Full Text Sources
Medical

