. 2011 Nov 8;7(11):3779-3792.
doi: 10.1021/ct200223q.

Molecular Mechanics Investigation of an Adenine-Adenine Non-Canonical Pair Conformational Change

Affiliations

Molecular Mechanics Investigation of an Adenine-Adenine Non-Canonical Pair Conformational Change

Keith P Van Nostrand et al. J Chem Theory Comput. .

Abstract

Conformational changes are important in RNA for binding and catalysis and understanding these changes is important for understanding how RNA functions. Computational techniques using all-atom molecular models can be used to characterize conformational changes in RNA. These techniques are applied to an RNA conformational change involving a single base pair within a nine base pair RNA duplex. The Adenine-Adenine (AA) non-canonical pair in the sequence 5'GGUGAAGGCU3' paired with 3'PCCGAAGCCG5', where P is Purine, undergoes conformational exchange between two conformations on the timescale of tens of microseconds, as demonstrated in a previous NMR solution structure [Chen, G., et al., Biochemistry, 2006. 45: 6889-903]. The more populated, major, conformation was estimated to be 0.5 to 1.3 kcal/mol more stable at 30 °C than the less populated, minor, conformation. Both conformations are trans-Hoogsteen/sugar edge pairs, where the interacting edges on the adenines change with the conformational change. Targeted Molecular Dynamics (TMD) and Nudged Elastic Band (NEB) were used to model the pathway between the major and minor conformations using the AMBER software package. The adenines were predicted to change conformation via intermediates in which they are stacked as opposed to hydrogen-bonded. The predicted pathways can be described by an improper dihedral angle reaction coordinate. Umbrella sampling along the reaction coordinate was performed to model the free energy profile for the conformational change using a total of 1800 ns of sampling. Although the barrier height between the major and minor conformations was reasonable, the free energy difference between the major and minor conformations was the opposite of that expected based on the NMR experiments. Variations in the force field applied did not improve the misrepresentation of the free energies of the major and minor conformations. As an alternative, the Molecular Mechanics Poisson-Boltzmann Surface Area (MMPBSA) approximation was applied to predict free energy differences between the two conformations using a total of 800 ns of sampling. MM-PBSA also incorrectly predicted the major conformation to be higher in free energy than the minor conformation.


Figures

Figure 1
Figure 1
Diagram of the AA non-canonical pair system, including the minor form on the left and major form on the right. The sequence for the AA non-canonical pair system is given at the top, including dangling ends that were removed for all simulations. Flanking GA pairs are in blue, A5 in green, and A15 in red. The yellow arrow indicates the single hydrogen bond stabilizing the non-canonical pair.
Figure 2
Figure 2
Mass weighted RMSD of all the atoms to the solution structure for implicit solvent simulations for the minor (a) and major (b) conformations.
Figure 3
Figure 3
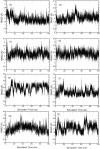
Mass weighted RMSD of all solute atoms to the solution structure for 100 ns of explicit solvent simulations in TIP3P water with neutralizing Na+ plus 1 M NaCl for the minor (a, b, c, d) and major (e, f, g, h) conformations. Four simulations were performed for each by changing the random number seed.
Figure 4
Figure 4
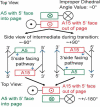
Definition of 5'- and 3'-side facing pathways. The circle with a dot indicates the backbone with the 5' end coming out of the page. The circle with an X is the backbone with the 5' end going into the page.
Figure 5
Figure 5
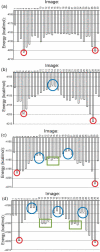
Variation in potential energy profiles for NEB trials. Red circles indicate images where the AMBER99 force field finds a more stable configuration than the experimental structure, an artifact of the force field. Potential energy profiles appear with no well-defined features (a), with single transition states (blue circles) (b), 2 transition states and 1 intermediate (green box) (c), and 3 transition states and 2 intermediates (d).
Figure 6
Figure 6
Definition of improper dihedral coordinate for the AA non-canonical pair. (a) Atoms for the improper dihedral are labeled. (b) The minor or reactant state starts at −8.7°. (c) The intermediate state for the 5'-side pathway occurs at −93.5°. (d) The major or product state is at −173.5°.
Figure 7
Figure 7
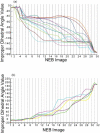
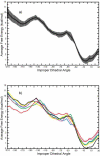
Plot of improper dihedral angle for initial NEB trials. (a) Plot of 15 NEB trials that follow the 5'-side pathway. Each trial is plotted in a distinct color. (b) Plot of improper dihedral angle for the 5 NEB trials that follow the 3'-side pathway.
Figure 8
Figure 8
Free energy profiles from sampling with AMBER99 force field and 1 M NaCl. (a) 12 ns of sampling of 25 windows for six random number seeds was combined to produce the free energy profile with WHAM, and the plotted error is the standard deviation error between trials. In total, 1800 ns of sampling was used to generate the free energy profile. (b) The free energy profiles for the six random number seeds are plotted separately.
Figure 9
Figure 9
Convergence in time for the umbrella sampling calculations. Free energy profiles were generated by combining six random number seeds where the colored lines correspond to 2 (blue), 4 (green), 8 (red), and 12 (black) ns of sampling for all windows.
Figure 10
Figure 10
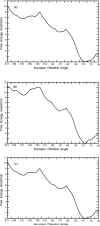
Free energy profiles from calculations using modified force field parameters. (a) The free energy profile produced using the Barcelona parameters (parmbsc0) with 12 ns of sampling for all 25 windows with TIP3P water, neutralizing Na+, and 1 M NaCl. (b) The free energy profile produced using AMBER99 force field with 12 ns of sampling and the TIP4PEW water model with neutralizing Na+ and 1 M NaCl. (c) Free energy profile from 12 ns of sampling of the AA non-canonical pair in neutralizing Na+ only and no additional salt. Overall features of the free energy profiles are similar to the final free energy curve with 1 M NaCl (Figure 8a), with major and minor states having similar energies and improper dihedral angle values.
Figure 11
Figure 11
Minor and major conformation loop region with residues labeled. The minor conformation is shown on the left and the major conformation on the right. This illustration shows that A15 is stacked on both G4 and G14 in the major conformation, but stacked on A6 and A16 in the minor conformation. A5, however, is stacked on A6 and A16 in the major conformation and stacked between G4 and G14 in the minor conformation.

References

    1. Williamson JR. Induced fit in RNA-protein recognition. Nat. Struct. Mol. Biol. 2000;7:834–837. - PubMed
    1. Patel DJ. Adaptive recognition in RNA complexes with peptides and protein modules. Curr. Opin. Struct. Biol. 1999;9:74–87. - PubMed
    1. Leulliot N, Varani G. Current topics in RNA-protein recognition: Control of specificity and biological function through induced fit and conformational capture. Biochemistry. 2001;40:7947–7956. - PubMed
    1. Nagan MC, Beuning P, Musier-Forsyth K, Cramer CJ. Importance of discriminator base stacking interactions: molecular dynamics analysis of A73 microhelix(Ala) variants. Nucleic Acids Res. 2000;28:2527–2534. - PMC - PubMed
    1. Sarzynska J, Kulinski T, Nilsson L. Conformational dynamics of a 5S rRNA hairpin domain containing loop D and a single nucleotide bulge. Biophys. J. 2000;79:1213–1227. - PMC - PubMed

LinkOut - more resources