. 2012 Jan 1;188(1):230-7.
doi: 10.4049/jimmunol.1101908. Epub 2011 Nov 23.

Memory CD4 T cells induce selective expression of IL-27 in CD8+ dendritic cells and regulate homeostatic naive T cell proliferation

Affiliations

Memory CD4 T cells induce selective expression of IL-27 in CD8+ dendritic cells and regulate homeostatic naive T cell proliferation

Jeong-Su Do et al. J Immunol. .

Abstract

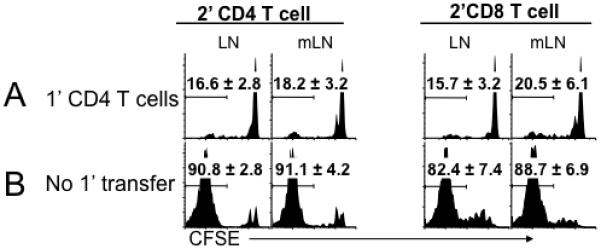
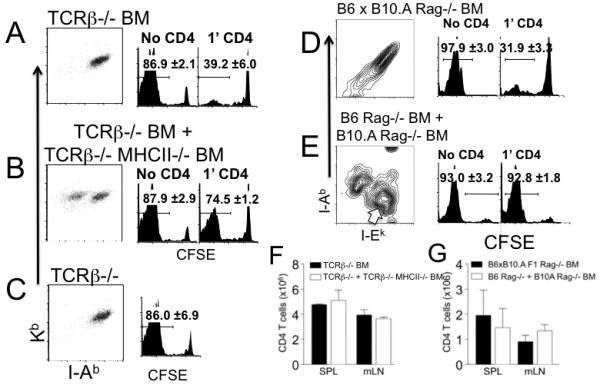
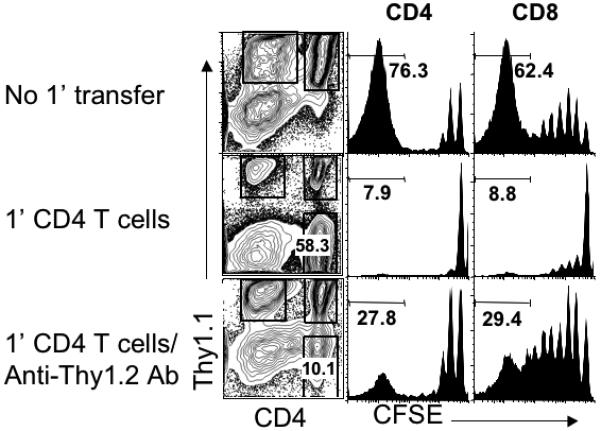
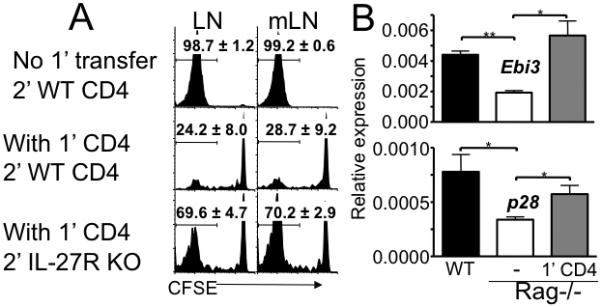
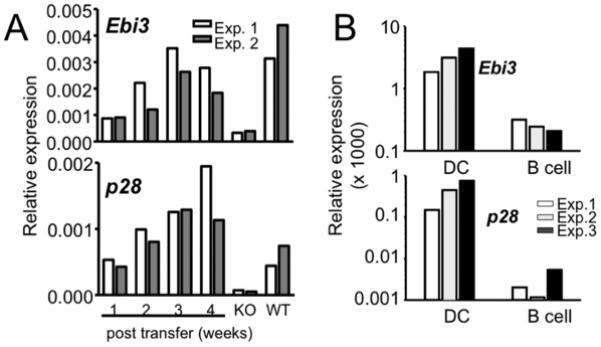
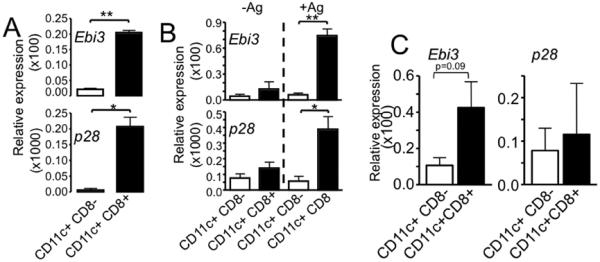
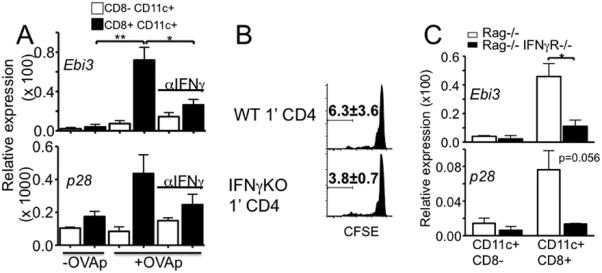
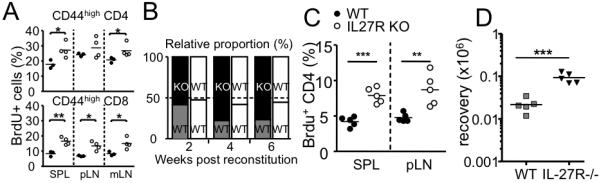
Naive T cells undergo robust proliferation in lymphopenic conditions, whereas they remain quiescent in steady-state conditions. However, a mechanism by which naive T cells are kept from proliferating under steady-state conditions remains unclear. In this study, we report that memory CD4 T cells are able to limit naive T cell proliferation within lymphopenic hosts by modulating stimulatory functions of dendritic cells (DC). The inhibition was mediated by IL-27, which was primarily expressed in CD8(+) DC subsets as the result of memory CD4 T cell-DC interaction. IL-27 appeared to be the major mediator of inhibition, as naive T cells deficient in IL-27R were resistant to memory CD4 T cell-mediated inhibition. Finally, IL-27-mediated regulation of T cell proliferation was also observed in steady-state conditions as well as during Ag-mediated immune responses. We propose a new model for maintaining peripheral T cell homeostasis via memory CD4 T cells and CD8(+) DC-derived IL-27 in vivo.


Figures

Figure 1
Figure 1. Preexisting memory phenotype CD4 T cells inhibit naïve T cell proliferation
A. Groups of Rag−/− mice were transferred with 3 × 10⁶ Thy1.2 CD4 T cells (1′ CD4). Subsequently, the recipients were transferred with CFSE labeled FACS sorted Thy1.1 naïve 2′ T cells (1 × 10⁶, containing both CD4 and CD8) 4 weeks post the 1′ CD4 transfer. Histograms shown are CFSE profiles of Thy1.1-gated T cells (2′ CD4 or 2′ CD8) examined 7 days post transfer. B. CFSE labeled Thy1.1 naïve T cells were transferred into Rag−/− mice. CFSE profiles were determined 7 days post transfer. The experiments were repeated three times and similar results were observed. The average ± SD of the proportion of T cells that fully diluted CFSE is indicated. LN, peripheral LN; mLN, mesenteric LN. Similar results were found in the spleen (not shown).
Figure 2
Figure 2. Memory CD4 T cells suppress naïve T cell proliferation through interacting the same APC
A and B. Lethally irradiated Rag−/− mice were transferred with BM cells from TCRβ−/− (A) or 1:1 mixture of TCRβ−/− and TCRβ−/− MHC II−/− mice (B). After 6 weeks of BM reconstitution, MHC I and MHC II expression of CD11c+ splenic DCs was examined by FACS analysis. The dot plots show the expression of Kb and I-Ab of CD11c+ splenic DC. The reconstituted mice were transferred with 3 × 10⁶ Thy1.2 CD4 T cells (1′ CD4). CFSE labeled Thy1.1 naïve CD8 T cell transfer was performed 4 weeks post the 1′ CD4 T cell transfer. CFSE profiles of the Thy1.1 CD8 T cells were examined 7 days post transfer (A and B, right histogram). CD8 T cells were also transferred into reconstituted recipients without the 1′ CD4 transfer (A and B, left histogram). Histograms shown are CFSE profiles of Thy1.1-gated CD8 T cells. C. CFSE labeled naïve Thy1.1 CD8 T cells were transferred into TCRβ−/− recipients and their proliferation was examined 7 days post transfer. Data are representative of 4 individually tested mice from two independent experiments. The average ± SD of the proportion of T cells that fully diluted CFSE is indicated. D and E. Irradiated B6 × B10.A Rag−/− F1 mice were reconstituted with BM cells from B6 × B10.A Rag−/− F1 (D) or with 1:1 mixture of BM cells from B6 Rag−/− and B10.A Rag−/− mice (E). After 6 weeks of BM transfer, reconstitution was confirmed by FACS analysis. Contour plots show expected I-Ab and I-Ek expression of CD11c+ splenic DCs (D and E). BM chimeras generated above were transferred with 3 × 10⁶ 1′ I-Ab restricted (and I-Ek/I-Ak tolerant) Thy1.1 CD4 T cells (please see Supplementary Figure S4). Four weeks post the 1′ transfer, the recipients were transferred with CFSE labeled Ly5.1 I-Ak/I-Ek restricted (I-Ab tolerant) FACS sorted naïve CD4 T cells. 250γg anti-NK1.1 mAb was injected at days -1, 3 and 6 of the second transfer. CFSE profiles were examined 7 days post transfer (right histogram). Naïve CD4 T cells were also transferred into reconstituted recipients without the 1′ CD4 transfer (left histogram). Histograms shown are CFSE profiles of Ly5.1-gated CD4 T cells. Data are representative of 4-5 individually tested mice from two independent experiments. The average ± SD of the proportion of T cells that fully diluted CFSE is indicated. (F) Total numbers of 1′ memory CD4 T cells from the groups described in the Figure 2A and 2B were counted by FACS analysis. (G) Total numbers of 1′ memory CD4 T cells from the groups described in the Figure 2D and 2E were counted. Data shown are the average ± SD from two independent experiments.
Figure 3
Figure 3. Continuous presence of memory CD4 T cells is necessary to inhibit naïve T cell proliferation
Rag−/− mice that received 1′ Thy1.2 CD4 T cells and 2′ CFSE labeled Thy1.1 naïve T cells as described above were injected with 250μg anti-Thy1.2 Ab at the time of 2′ naïve T cell injection. Shown are the CFSE profiles of donor T cells in the LN tissues examined 7 days post the 2′ transfer. Similar results were observed in the spleen tissues. The number shown in the histograms indicates the proportion of donor T cells that fully diluted the CFSE. Similar results were observed from two independent experiments.
Figure 4
Figure 4. IL-27 induced by CD4 T cells inhibits naïve T cell proliferation
A. Groups of Thy1.1 TCRβ−/− mice were transferred with 3 × 10⁶ Thy1.1 CD4 T cells (1′ CD4) and with 1 × 10⁶ CFSE labeled Thy1.2 naïve CD4 T cells isolated from wild type or IL-27R−/− mice at 4 weeks post 1′ transfer. CFSE profiles of Thy1.2-gated CD4 T cells were examined 7 days post transfer. Histograms shown are representative of 4 individually tested mice from two independent experiments. The average ± SD of the proportion of T cells that fully diluted CFSE is indicated. LN, peripheral LN; mLN, mesenteric LN. Similar results were found in the spleen (not shown). B. CD11c+ DC were FACS sorted from spleen cells of wild type, Rag−/−, and Rag−/− mice that received 1′ CD4 T cells (4 weeks earlier). Expression of Ebi3 and p28 was measured by quantitative PCR analysis. The expression was normalized to endogenous control GAPDH. Data shown are the mean ± SD of two independent experiments. *, p<0.01; **, p<0.05.
Figure 5
Figure 5. IL-27 is primarily expressed by DC
(A) Kinetics of IL-27 expression following CD4 T cell transfer. Groups of TCRβ−/− mice were transferred with CD4 T cells. IL-27 expression in CD11c+ splenic DC was weekly measured by qPCR. Wild type B6 and TCRβ−/− mice are included as positive and negative control, respectively. (B) IL-27 subunits expression by DCs and B cells. CD11c+ DCs and CD19+ B cells were sorted from splenocytes of TCRβ−/− mice that received CD4 T cells 4 weeks earlier. Expression of IL-27 subunits was subsequently examined. Experiments were repeated three times as shown.
Figure 6
Figure 6. IL-27 is primarily expressed by CD8+ DC subsets
A. Splenic DC from wild type B6 mice were sorted into different subsets based on the expression of CD8. Expression of IL-27 subsets was determined by real time PCR analysis. The experiments were repeated twice with similar results. B. Bone marrow derived DCs were cocultured with OVA-specific OT-II CD4 T cells with or without OVA peptide antigen. After 48 hours of culture, DCs were sorted from the culture into CD8+ and CD8− CD11c+ cells, and the expression of IL-27 subunits was determined by qPCR analysis. The experiments were repeated twice with similar results. C. CD8+ and CD8− splenic DC subsets were purified from Rag−/− mice that received CD4 T cells 7 days earlier by cell sorting and IL-27 expression was examined by qPCR. Expression of Ebi3 and p28 was normalized to endogenous control GAPDH. The data shown is average ± SD from two independent experiments. *, p<0.01; **, p<0.05.
Figure 7
Figure 7. IFNγ induces IL-27 expression in CD8+ DC
A. OT-II T cells were cocultured with BM derived DC in the presence or absence of neutralizing anti-IFNγ Ab. CD8+ and CD8− DC were sorted from the culture 48 hours later. IL-27 expression was examined by qPCR. Coculture without peptide was included as a control. The data shown is average ± SD from two independent experiments. B. Rag−/− mice were transferred with wild type or IFNγ−/− CD4 T cells. Four weeks later, CFSE labeled Thy1.1 naïve CD4 T cells were transferred into the recipients. CFSE profiles of newly transferred cells were determined 7 days post transfer. The data shown is average ± SD from two independent experiments. C. CD4 T cells were transferred into Rag−/− or Rag−/− IFNγR−/− recipients. CD8+ and CD8− splenic DC were sorted 10 days post transfer and IL-27 expression was examined by qPCR. *, p<0.01; **, p<0.05.
Figure 8
Figure 8. IL-27 regulates T cell proliferation in steady-state conditions as well as during Ag-mediated immune responses
A. Groups of wild type (filled circle) and IL-27R−/− (open circle) mice were injected with BrdU. Mice were sacrificed 24 hours later and BrdU incorporation by CD44high memory phenotype T cells was examined. Each symbol represents individually tested mice. B and C. Groups of irradiated Rag−/− mice were reconstituted with 1:1 mixture of Ly5.1 WT plus Ly5.2 IL-27R−/− (or Ly5.2 WT) BM cells. B. Following the reconstitution, mice were bled every two weeks, and the relative proportion of Ly5.1/Ly5.2 T cells was examined. C. In vivo proliferation of reconstituted CD4 T cells was examined by BrdU incorporation experiments as described above. D. 5 × 10⁵ WT or IL-27R−/− Ly5.1 OT-II CD4 T cells were transferred into B6 recipients. The recipients were subsequently immunized s.c. with 50γg OVA protein plus 10μg LPS. Ly5.1 T cell expansion within the draining lymph node was determined by FACS analysis 7 days post immunization. Each symbol represents individually tested mouse. *, p<0.01; **, p<0.05; ***, p<0.001.

References

    1. Boyman O, Letourneau S, Krieg C, Sprent J. Homeostatic proliferation and survival of naive and memory T cells. Eur J Immunol. 2009;39:2088–2094. - PubMed
    1. Williams KM, Hakim FT, Gress RE. T cell immune reconstitution following lymphodepletion. Semin Immunol. 2007;19:318–330. - PMC - PubMed
    1. Tanchot C, Rosado MM, Agenes F, Freitas AA, Rocha B. Lymphocyte homeostasis. Semin Immunol. 1997;9:331–337. - PubMed
    1. Kieper WC, Troy A, Burghardt JT, Ramsey C, Lee JY, Jiang HQ, Dummer W, Shen H, Cebra JJ, Surh CD. Recent immune status determines the source of antigens that drive homeostatic T cell expansion. J Immunol. 2005;174:3158–3163. - PubMed
    1. Prlic M, Jameson SC. Homeostatic expansion versus antigen-driven proliferation: common ends by different means? Microbes Infect. 2002;4:531–537. - PubMed

Publication types

MeSH terms