. 2012 May;19(5):871-81.
doi: 10.1038/cdd.2011.171. Epub 2011 Nov 25.

Inhibition of Notch3 signalling induces rhabdomyosarcoma cell differentiation promoting p38 phosphorylation and p21(Cip1) expression and hampers tumour cell growth in vitro and in vivo

Affiliations

Inhibition of Notch3 signalling induces rhabdomyosarcoma cell differentiation promoting p38 phosphorylation and p21(Cip1) expression and hampers tumour cell growth in vitro and in vivo

L Raimondi et al. Cell Death Differ. 2012 May.

Abstract

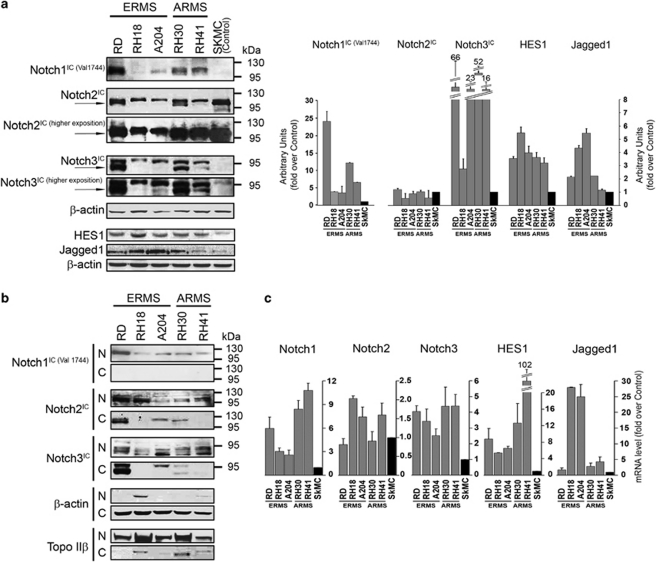
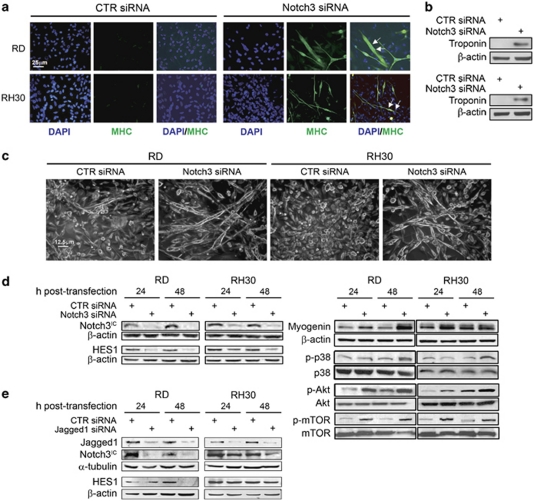
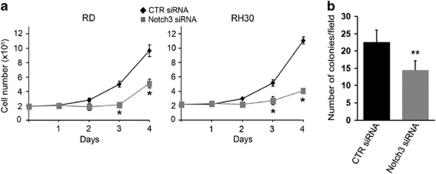
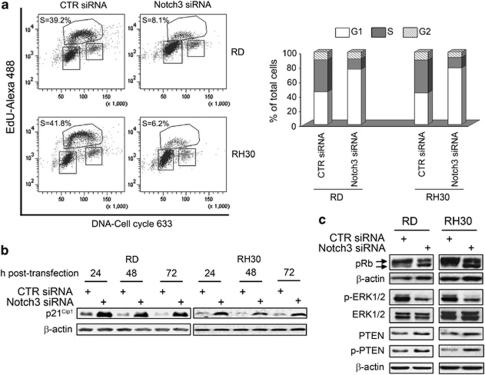
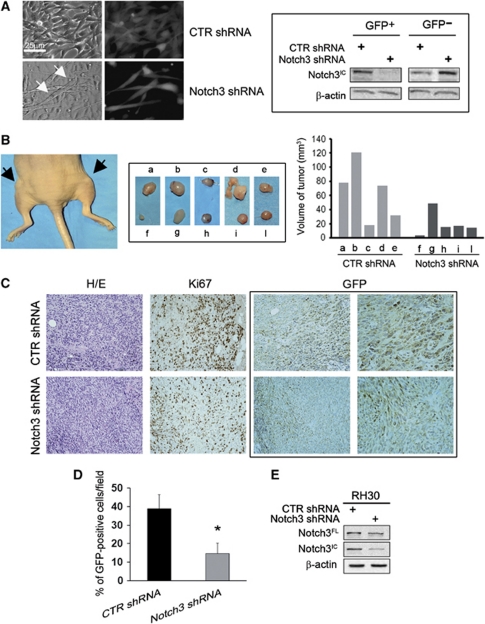
Rhabdomyosarcoma (RMS) is a paediatric soft-tissue sarcoma arising from skeletal muscle precursors coexpressing markers of proliferation and differentiation. Inducers of myogenic differentiation suppress RMS tumourigenic phenotype. The Notch target gene HES1 is upregulated in RMS and prevents tumour cell differentiation in a Notch-dependent manner. However, Notch receptors regulating this phenomenon are unknown. In agreement with data in RMS primary tumours, we show here that the Notch3 receptor is overexpressed in RMS cell lines versus normal myoblasts. Notch3-targeted downregulation in RMS cells induces hyper-phosphorylation of p38 and Akt essential for myogenesis, resulting in the differentiation of tumour cells into multinucleated myotubes expressing Myosin Heavy Chain. These phenomena are associated to a marked decrease in HES1 expression, an increase in p21(Cip1) level and the accumulation of RMS cells in the G1 phase. HES1-forced overexpression in RMS cells reverses, at least in part, the pro-differentiative effects of Notch3 downregulation. Notch3 depletion also reduces the tumourigenic potential of RMS cells both in vitro and in vivo. These results indicate that downregulation of Notch3 is sufficient to force RMS cells into completing a correct full myogenic program providing evidence that it contributes, partially through HES1 sustained expression, to their malignant phenotype. Moreover, they suggest Notch3 as a novel potential target in human RMS.


Figures

Figure 1
Figure 1
Upregulation of Notch signaling components in rhabdomyosarcoma (RMS) cell lines. (a, left) Western blotting of Notch1-3 intracellular cleaved domains (IC), Jagged1, HES1 and β-actin (loading control) in whole-cell lysates from embryonal (ERMS) and alveolar (ARMS) RMS cell lines and normal human myoblasts SkMCs as control. Arrows indicate the IC domains of Notch1-3. Notch1IC was detected using the antibody that recognizes only the activated form (cleaved at Val1744). (a, right) Histograms report densitometric analysis of Notch1IC (Val1744), Notch2IC, Notch3IC, HES1, and Jagged1 bands normalized to β-actin of three independent experiments. (b) Western blot analysis of nuclear (N) and cytoplasmic (C) -enriched cell fractions of embryonal (ERMS) and alveolar (ARMS) RMS cell lines. Notch1IC (Val1744), Notch2IC and Notch3IC forms were detected in all cell lines. β-actin and topoisomerase IIβ were used as loading controls to discriminate the different cell fractions. (c) mRNA levels of Notch1-3, HES1 and Jagged1 (real time RT-PCR) were normalized to β-actin levels and expressed as fold increase over control SkMC (black column; 1 arbitrary unit). Columns, means; Bars, S.D. Results from three independent experiments are shown
Figure 2
Figure 2
Notch3 downregulation promotes RMS cell differentiation. (a) RD and RH30 cells cultured in complete medium (i.e., supplemented with 10% of fetal calf serum) were analyzed after 6 days of Notch3 or control (CTR) siRNA treatment. Representative immunofluorescence showing de novo expression of endogenous myosin heavy chain (MHC, green) in multinucleated fibers of Notch3 siRNA-transfected RD and RH30 cells (white arrows). Representative of three assays. (b) Western blotting showing de novo expression of Troponin I and β-actin (loading control) in Notch3 siRNA RD and RH30 cells treated as in (a). (c) Representative light microscopy pictures of RD and RH30 cells showing elongated multinucleated structures in Notch3 siRNA-treated cells treated as in (a). (d) Western blotting showing levels of Notch3IC and HES1 (left) and Myogenin along with the phosphorylation of p38, Akt and mTOR (right) in RD and RH30 cells 24 and 48 h after CTR or Notch3 siRNA transfection. β-actin was the loading control. Representative of three independent experiments. (e) Western blotting showing levels of Notch3IC and HES1 in RD and RH30 cells 24 and 48 h after CTR or Jagged1 siRNA transfection. β-actin was the loading control. Representative of three independent experiments
Figure 3
Figure 3
Notch3 depletion reduces proliferation and impairs RMS cell lines tumourigenic features in vitro. (a) RD and RH30 cells were transfected (t0) with Notch3 siRNA or control (CTR) siRNA, cultured in complete medium (i.e. supplemented with 10% of fetal calf serum) and harvested and counted at the indicated time points. *P<0.05; Bars, SD. (b) 2 × 10⁴ RD living cells (evidenced by trypan blue exclusion) were seeded on soft-agar in 35 mm petri dishes 48 h after transfection with CTR or Notch3 siRNA. Histogram represents the mean number of colonies per field counted under a light inverted microscope 4 weeks after seeding (two independent experiments in triplicate). At least five fields per dish were checked at 100 × magnification. Bars, S.D. **P<0.001
Figure 4
Figure 4
Notch3 downregulation prevents the G1-to-S phase transition in RMS cell lines. (a) RD and RH30 cells were transfected with Notch3 siRNA or control (CTR) siRNA and, 48 h later, stained with 5-ethynyl-2′-deoxyuridine (EdU)-Alexa 488/Cell cycle 633 for analysis by flow cytometry gating on living cells. Left, representative diagrams. Right, the histogram depicts the percentage of control (CTR) or Notch3 siRNA transfected RD and RH30 cells in G1, S and G2 phases. Representative of three independent experiments in duplicate. (b and c) Western blotting showing expression of p21Cip1, PTEN and the Ser380 phophorylated form of PTEN, and pRb along with the phosphorylation of ERK1/2 in whole-cell extracts after CTR or Notch3 siRNA transfection. Arrows (c) point to bands corresponding to hyper- (upper) and hypo-phosphorylated (lower) pRb species. β-actin was the loading control
Figure 5
Figure 5
HES1 downregulation in RMS cells induces cell differentiation mimicking the effect of Notch3 knockdown. RD and RH30 cells were transfected with a Notch3 or control (CTR) siRNA, and 24 h later they were transfected with a HES1 or control (CTR) siRNA* in complete medium (i.e., supplemented with 10% of fetal calf serum). (a) Western blotting showing expression of p21Cip1 and Myogenin 48 h after HES1 silencing in whole-cell extracts. (b) Immunofluorescence analysis shows de novo expression of endogenous myosin heavy chain (MHC, red) in multinucleated fibers of Notch3, HES1 and Notch3 plus HES1 siRNA-transfected RD and RH30 cells after 6 days. Representative images of three assays
Figure 6
Figure 6
HES1 overexpression in RMS cells abrogates the effects of Notch3 knockdown. RD and RH30 cells were infected with an Adenovirus expressing HES1 (AdHES1) or a control Adenovirus (Ad-GFP) 24 h after transfection with CTR or Notch3 siRNAs. (a) Western blotting showing levels of Notch3IC, HES1, Myogenin and p21Cip1 24 h and 48 h after Adenovirus infection. β-actin and α-tubulin were the loading controls. Representative of three independent experiments. (b) Cell cycle analysis by propidium iodide of RD and RH30 cells 48 h after adenovirus infection with AdHES1 and AdGFP. Left, representative diagrams. Right, histograms depict the fold change of the cell percentage in the different cell cycle phases for AdHES1 versus AdGFP infected RD and RH30 cells, after normalization for the efficiency of infection (Supplementary Figure 3). (c) Immunofluorescence analysis of AdHES1- and AdGFP-infected RD and RH30 cells (GFP, green) with anti-myosin heavy chain (MHC, red) antibody 6 days after infection. Representative images of three independent experiments
Figure 7
Figure 7
Notch3 downregulation in RMS cells reduces tumour growth in vivo. (A) RH-30 cells were transfected with a Notch3 short hairpin (sh)RNA- or control (CTR) shRNA-GFP-plasmids and images of GFP fluorescence (grey) were acquired after 3 weeks of puromycin selection (Left). Arrows depict nuclei of newly formed myofibers (200 × magnification). (Right) 48 h post-shRNAs transfection, positive GFP was separated from negative GFP cells by cell sorting and expression of Notch3IC, and β-actin (loading control) were analyzed by western blotting. Representative of two independent experiments. (B, Left) Mouse-bearing CTR shRNA (as a mixture of control (CTR) shRNA-GFP/wild-type cells) and Notch3 shRNA (as a mixture of Notch3 shRNA-GFP/wild-type cells) tumour xenografts (black arrows; left flank: a and right flank: f, respectively). (Middle) xenografts from nude mice injected with Notch3 shRNA RH30 cells (wild-type/Notch3 shRNA cell ratio ∼60%/40% f, g, h, i and l). Xenografts from CTR shRNA cells (wild-type/CTR shRNA cell ratio ∼50%/50% a, b, c, d and e) were controls. (Right) Histogram reports tumour volumes of each xenograft. (C, Left) Haematoxylin/eosin staining and immunolabeling of Ki67 and GFP of 5 μm serial sections from xenografts of mice injected with CTR shRNA and Notch3 shRNA RH30 cells (from d and i samples) (400 × magnification). GFP right panels are a higher magnification of left panels (600 × magnification). Representative of three xenografts per condition. (D) Histogram depicts the average of the percentage of GFP-positive cells per field in five fields per tumour section. Bars, S.D. *P<0.05. (E) The expression of Notch3IC was analysed by western blotting in lysates of samples from mice injected with CTR shRNA and Notch3 shRNA RH30 cell suspensions (three xenografts were pooled per group)

References

    1. Loeb DM, Thornton K, Shokek O.Pediatric soft tissue sarcomas Surg Clin North Am 200888615–627.vii. - PMC - PubMed
    1. Williamson D, Missiaglia E, de Reynies A, Pierron G, Thuille B, Palenzuela G, et al. Fusion gene-negative alveolar rhabdomyosarcoma is clinically and molecularly indistinguishable from embryonal rhabdomyosarcoma. J Clin Oncol. 2010;28:2151–2158. - PubMed
    1. Tapscott SJ, Thayer MJ, Weintraub H. Deficiency in rhabdomyosarcomas of a factor required for MyoD activity and myogenesis. Science. 1993;259:1450–1453. - PubMed
    1. Wang H, Garzon R, Sun H, Ladner KJ, Singh R, Dahlman J, et al. NF-kappaB-YY1-miR-29 regulatory circuitry in skeletal myogenesis and rhabdomyosarcoma. Cancer Cell. 2008;14:369–381. - PMC - PubMed
    1. Taulli R, Bersani F, Foglizzo V, Linari A, Vigna E, Ladanyi M, et al. The muscle-specific microRNA miR-206 blocks human rhabdomyosarcoma growth in xenotransplanted mice by promoting myogenic differentiation. J Clin Invest. 2009;119:2366–2378. - PMC - PubMed

Publication types

MeSH terms

Substances