

Therapeutic targeting of Chk1 in NSCLC stem cells during chemotherapy
- PMID: 22117197
- PMCID: PMC3321626
- DOI: 10.1038/cdd.2011.170
Therapeutic targeting of Chk1 in NSCLC stem cells during chemotherapy
Abstract
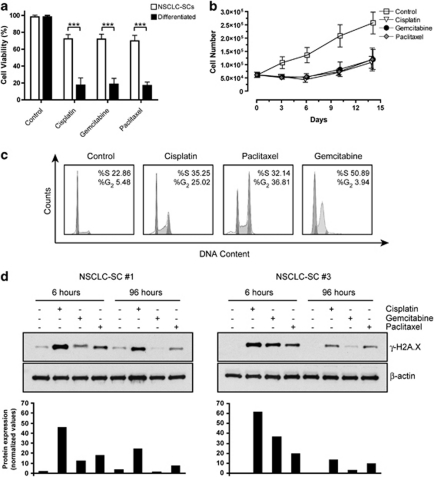
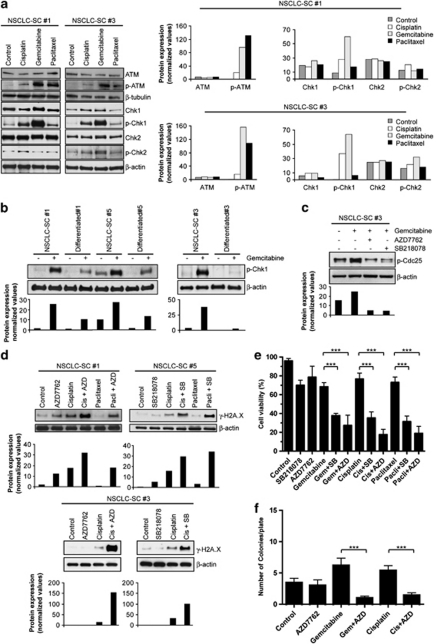
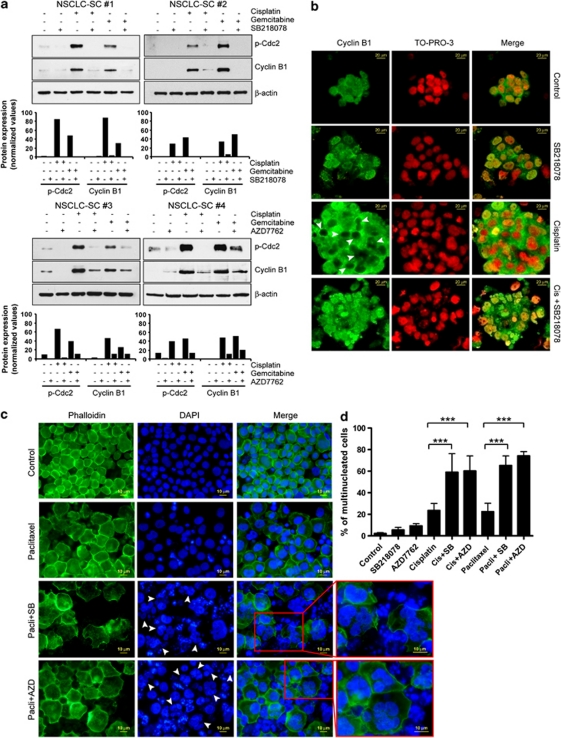
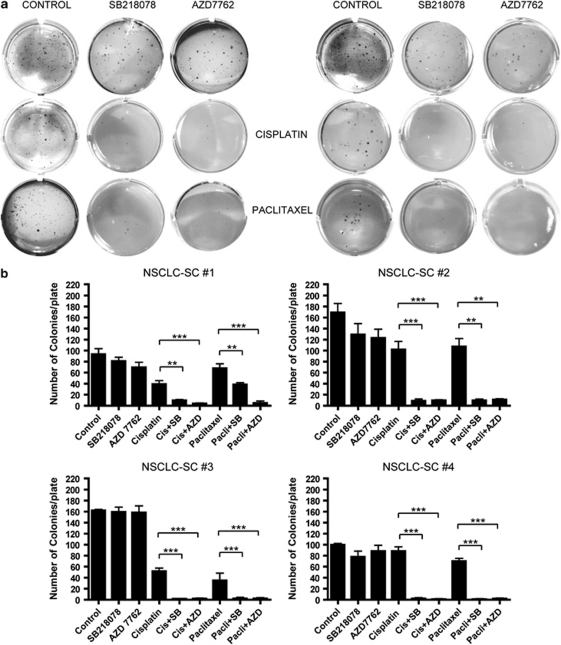
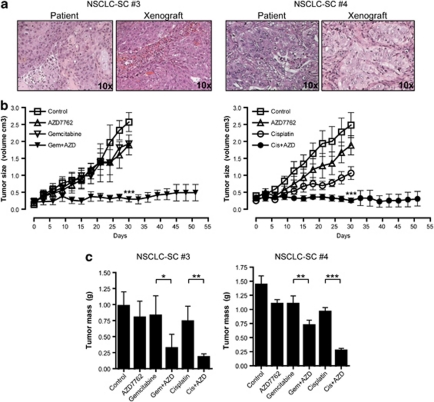
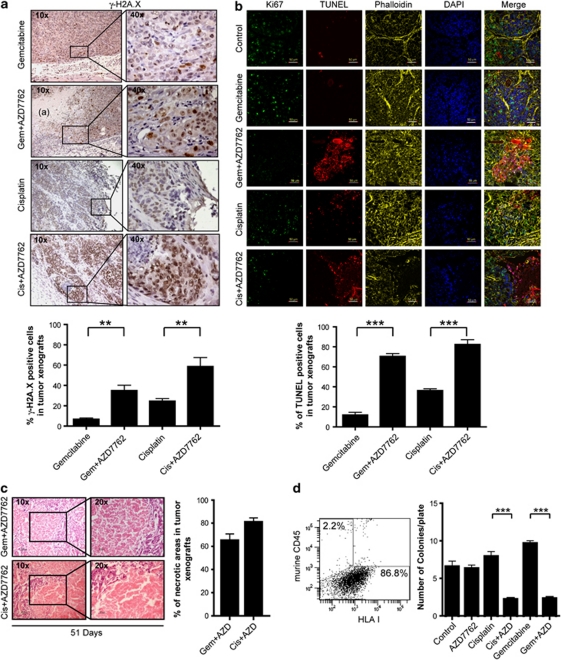
Cancer stem cell (SC) chemoresistance may be responsible for the poor clinical outcome of non-small-cell lung cancer (NSCLC) patients. In order to identify the molecular events that contribute to NSCLC chemoresistance, we investigated the DNA damage response in SCs derived from NSCLC patients. We found that after exposure to chemotherapeutic drugs NSCLC-SCs undergo cell cycle arrest, thus allowing DNA damage repair and subsequent cell survival. Activation of the DNA damage checkpoint protein kinase (Chk) 1 was the earliest and most significant event detected in NSCLC-SCs treated with chemotherapy, independently of their p53 status. In contrast, a weak Chk1 activation was found in differentiated NSCLC cells, corresponding to an increased sensitivity to chemotherapeutic drugs as compared with their undifferentiated counterparts. The use of Chk1 inhibitors in combination with chemotherapy dramatically reduced NSCLC-SC survival in vitro by inducing premature cell cycle progression and mitotic catastrophe. Consistently, the co-administration of the Chk1 inhibitor AZD7762 and chemotherapy abrogated tumor growth in vivo, whereas chemotherapy alone was scarcely effective. Such increased efficacy in the combined use of Chk1 inhibitors and chemotherapy was associated with a significant reduction of NSCLC-SCs in mouse xenografts. Taken together, these observations support the clinical evaluation of Chk1 inhibitors in combination with chemotherapy for a more effective treatment of NSCLC.
Figures
Similar articles
-
Checkpoint kinase 1 protein expression indicates sensitization to therapy by checkpoint kinase 1 inhibition in non-small cell lung cancer.J Surg Res. 2014 Mar;187(1):6-13. doi: 10.1016/j.jss.2013.12.016. Epub 2013 Dec 18. J Surg Res. 2014. PMID: 24418519 Free PMC article.
-
Mechanism of radiosensitization by the Chk1/2 inhibitor AZD7762 involves abrogation of the G2 checkpoint and inhibition of homologous recombinational DNA repair.Cancer Res. 2010 Jun 15;70(12):4972-81. doi: 10.1158/0008-5472.CAN-09-3573. Epub 2010 May 25. Cancer Res. 2010. PMID: 20501833 Free PMC article.
-
Sensitization of pancreatic cancer stem cells to gemcitabine by Chk1 inhibition.Neoplasia. 2012 Jun;14(6):519-25. doi: 10.1593/neo.12538. Neoplasia. 2012. PMID: 22787433 Free PMC article.
-
Chk1 inhibitors for novel cancer treatment.Anticancer Agents Med Chem. 2006 Jul;6(4):377-88. doi: 10.2174/187152006777698132. Anticancer Agents Med Chem. 2006. PMID: 16842237 Review.
-
Clinical relevance of stem cells in lung cancer.World J Stem Cells. 2023 Jun 26;15(6):576-588. doi: 10.4252/wjsc.v15.i6.576. World J Stem Cells. 2023. PMID: 37424954 Free PMC article. Review.
Cited by
-
A synthetic lethal screen identifies the Vitamin D receptor as a novel gemcitabine sensitizer in pancreatic cancer cells.Cell Cycle. 2014;13(24):3839-56. doi: 10.4161/15384101.2014.967070. Cell Cycle. 2014. PMID: 25558828 Free PMC article.
-
UCN-01 enhances cytotoxicity of irinotecan in colorectal cancer stem-like cells by impairing DNA damage response.Oncotarget. 2016 Jul 12;7(28):44113-44128. doi: 10.18632/oncotarget.9859. Oncotarget. 2016. PMID: 27286453 Free PMC article.
-
Identification of Master Regulators Driving Disease Progression, Relapse, and Drug Resistance in Lung Adenocarcinoma.Front Bioinform. 2022 Jan 28;2:813960. doi: 10.3389/fbinf.2022.813960. eCollection 2022. Front Bioinform. 2022. PMID: 36304306 Free PMC article.
-
Blocking the epithelial-to-mesenchymal transition pathway abrogates resistance to anti-folate chemotherapy in lung cancer.Cell Death Dis. 2015 Jul 16;6(7):e1824. doi: 10.1038/cddis.2015.195. Cell Death Dis. 2015. PMID: 26181204 Free PMC article.
-
Cancer Stem Cells and Radioresistance: DNA Repair and Beyond.Cancers (Basel). 2019 Jun 21;11(6):862. doi: 10.3390/cancers11060862. Cancers (Basel). 2019. PMID: 31234336 Free PMC article. Review.
References
-
- Jemal A, Siegel R, Ward E, Hao Y, Xu J, Thun MJ. Cancer statistics, 2009. CA Cancer J Clin. 2009;59:225–249. - PubMed
-
- Travis WD, Travis LB, Devesa SS. Lung cancer. Cancer. 1995;75 (1 Suppl:191–202. - PubMed
-
- Collins LG, Haines C, Perkel R, Enck RE. Lung cancer: diagnosis and management. Am Fam Physician. 2007;75:56–63. - PubMed
-
- Eramo A, Lotti F, Sette G, Pilozzi E, Biffoni M, Di Virgilio A, et al. Identification and expansion of the tumorigenic lung cancer stem cell population. Cell Death Differ. 2008;15:504–514. - PubMed
Publication types
MeSH terms
Substances
LinkOut - more resources
Full Text Sources
Other Literature Sources
Research Materials
Miscellaneous
