. 2011 Nov 25:12:458.
doi: 10.1186/1471-2105-12-458.

Multiple-input multiple-output causal strategies for gene selection

Affiliations

Multiple-input multiple-output causal strategies for gene selection

Gianluca Bontempi et al. BMC Bioinformatics. .

Abstract

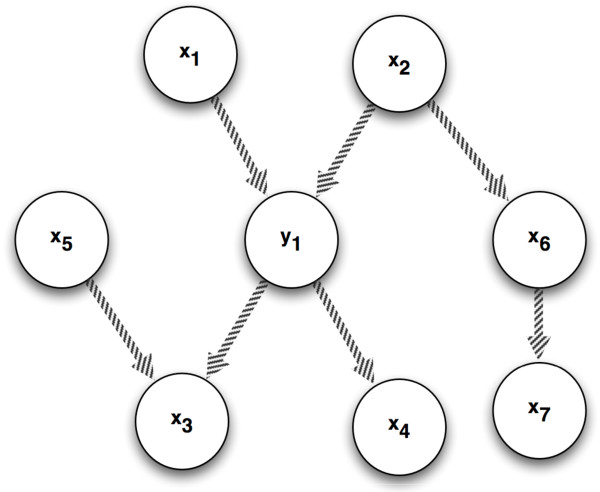
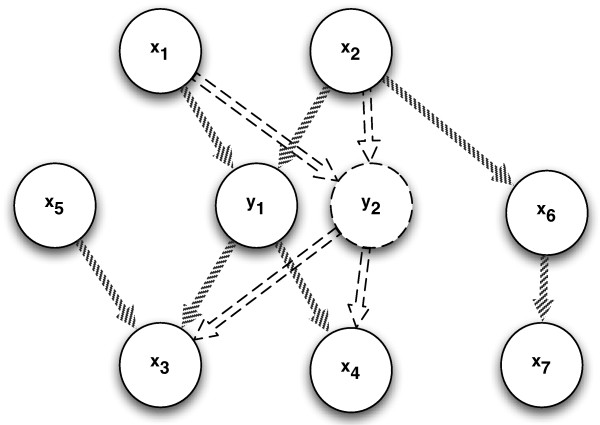
Background: Traditional strategies for selecting variables in high dimensional classification problems aim to find sets of maximally relevant variables able to explain the target variations. If these techniques may be effective in generalization accuracy they often do not reveal direct causes. The latter is essentially related to the fact that high correlation (or relevance) does not imply causation. In this study, we show how to efficiently incorporate causal information into gene selection by moving from a single-input single-output to a multiple-input multiple-output setting.

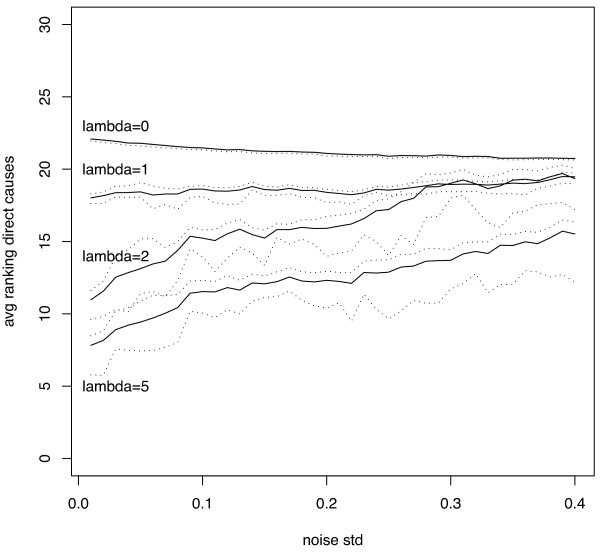
Results: We show in synthetic case study that a better prioritization of causal variables can be obtained by considering a relevance score which incorporates a causal term. In addition we show, in a meta-analysis study of six publicly available breast cancer microarray datasets, that the improvement occurs also in terms of accuracy. The biological interpretation of the results confirms the potential of a causal approach to gene selection.

Conclusions: Integrating causal information into gene selection algorithms is effective both in terms of prediction accuracy and biological interpretation.


Figures

Figure 1
Figure 1
Single-output case with different causal patterns: (i) common effect or explaining away effect configuration involving x1, x2 and y1; (ii) spouse configuration involving x5 and y1; (iii) common cause configuration involving y1, x3, x4; and (iv) causal chain configuration involving x1, y1, x4.
Figure 2
Figure 2
Two-output case with different causal patterns: (i) common effect configuration involving x3, y1 and y2; (ii) spouse configuration involving y2 and x6; (iii) common cause configuration involving x1, y1 and y2; and (iv) causal chain configuration involving x1, y2 and x7.
Figure 3
Figure 3
Two-inputs two-outputs causal pattern.
Figure 4
Figure 4
Bayesian causal network used for synthetic experiment. The green node 9 denotes the non observable variable. The three red nodes denote the targets of the multiple-output classification problem. The isolated node (30-40) represents a set of 11 independent variables.
Figure 5
Figure 5
Synthetic data experiment: average ranking of direct causes for different values of λ as a function of the noise standard deviation. Dotted lines are used to denote the 90% confidence interval estimated on the basis of 150 trials.
Figure 6
Figure 6
Synthetic data experiment: probability of selecting a direct cause among the first 5 ranked variables for different values of λ as a function of the noise standard deviation. Dotted lines are used to denote the 90% confidence interval estimated on the basis of 150 trials.
Figure 7
Figure 7
Most enriched GO terms with respect to λ according to a pre-ranked gene set enrichment analysis (GSEA): (A) GO terms enriched in the conventional ranking and having a high degree of causality for tumorigenesis; (B) GO terms increasingly enriched with respect to larger λ, suggesting they are putative causes for tumorigenesis; (C) GO terms decreasingly enriched with respect to larger λ, suggesting they are putative effects for tumorigenesis. The normalized enrichment score (NES) depends on the genome-ranking of the genes, which in turn depends on λ. Larger the NES of a GO term, stronger the association of this gene set with survival; the sign of NES reflects the direction of association of the GO term with survival, a positive score meaning that over-expression of the genes implies worst survival and inversely.

References

    1. Saeys Y, Inza I, Larranaga P. A review of feature selection techniques in bioinformatics. Bioinformatics. 2007;23:2507–2517. doi: 10.1093/bioinformatics/btm344. - DOI - PubMed
    1. Guyon I, Elisseeff A. An introduction to variable and feature selection. Journal of Machine Learning Research. 2003;3:1157–1182.
    1. Shipley B. Cause and Correlation in Biology. Cambridge University Press; 2000.
    1. Guyon I, Aliferis C, Elisseeff A. Computational Methods of Feature Selection. Chapman and Hall; 2007. pp. 63–86. chap. Causal Feature Selection.
    1. Bontempi G, Meyer P. Proceedings of the 27th International Conf. on Machine Learning. Morgan Kaufmann, San Francisco, CA; 2010. Causal filter selection in microarray data.

Publication types