. 2012 Mar;13(3):468-82.
doi: 10.1111/j.1600-0854.2011.01314.x. Epub 2012 Jan 8.

Regulation of membrane protein degradation by starvation-response pathways

Affiliations

Regulation of membrane protein degradation by starvation-response pathways

Charles B Jones et al. Traffic. 2012 Mar.

Abstract

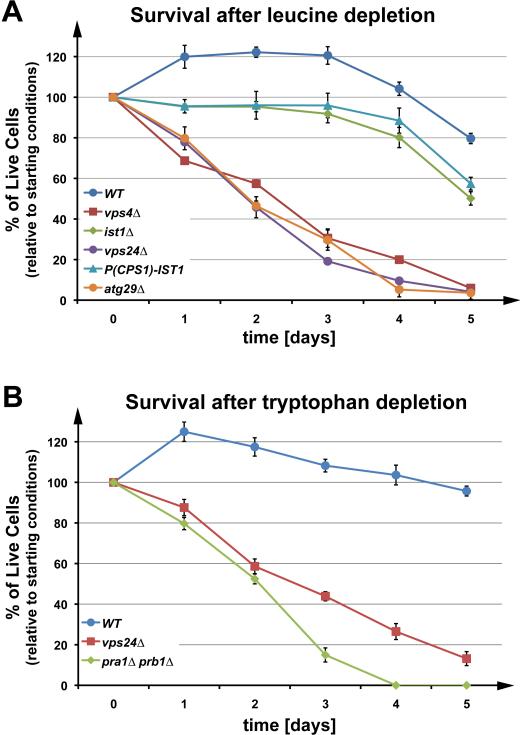
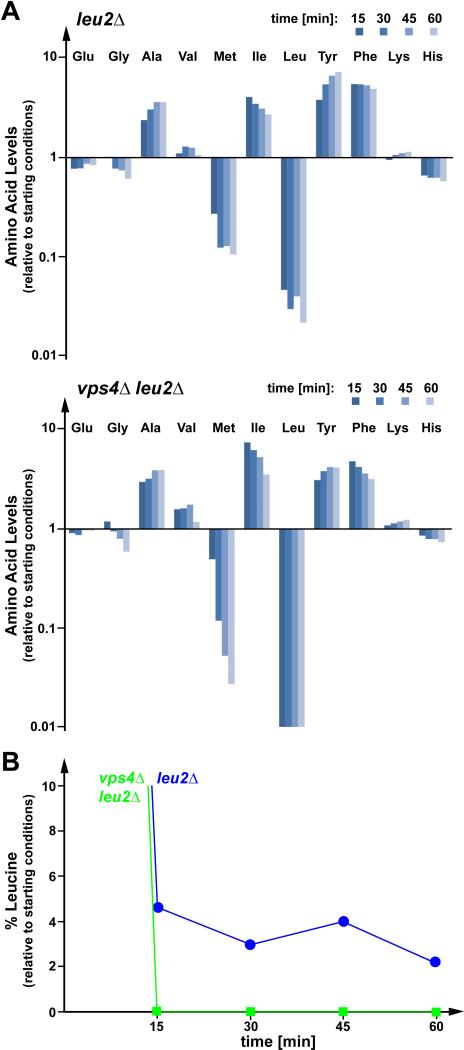
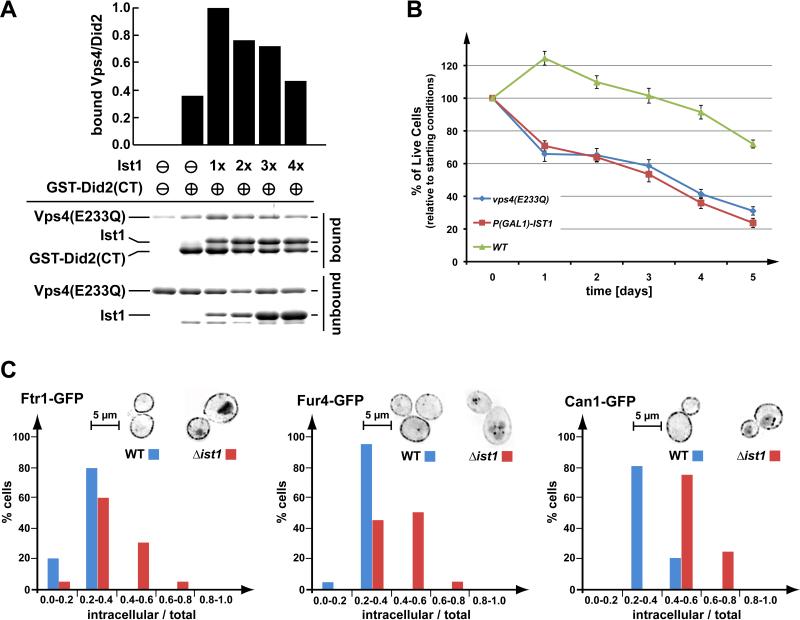
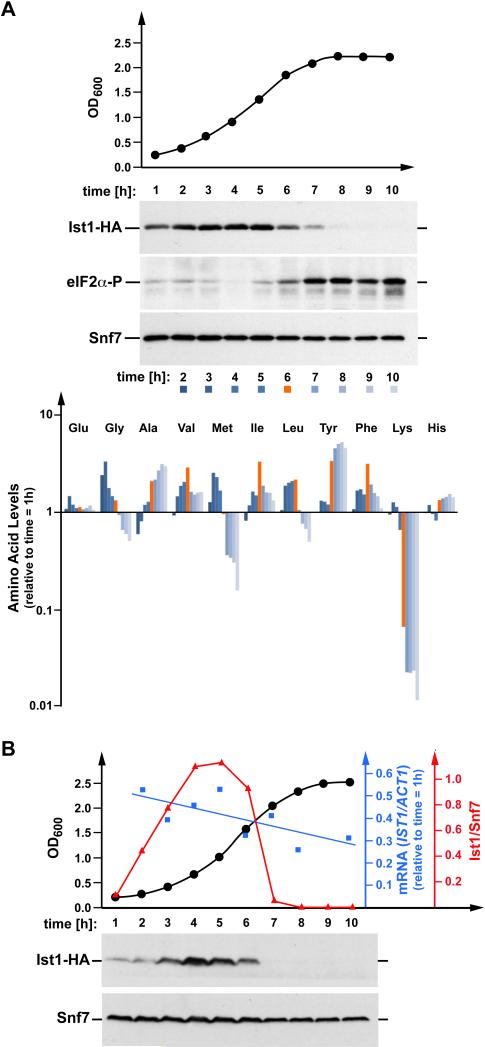
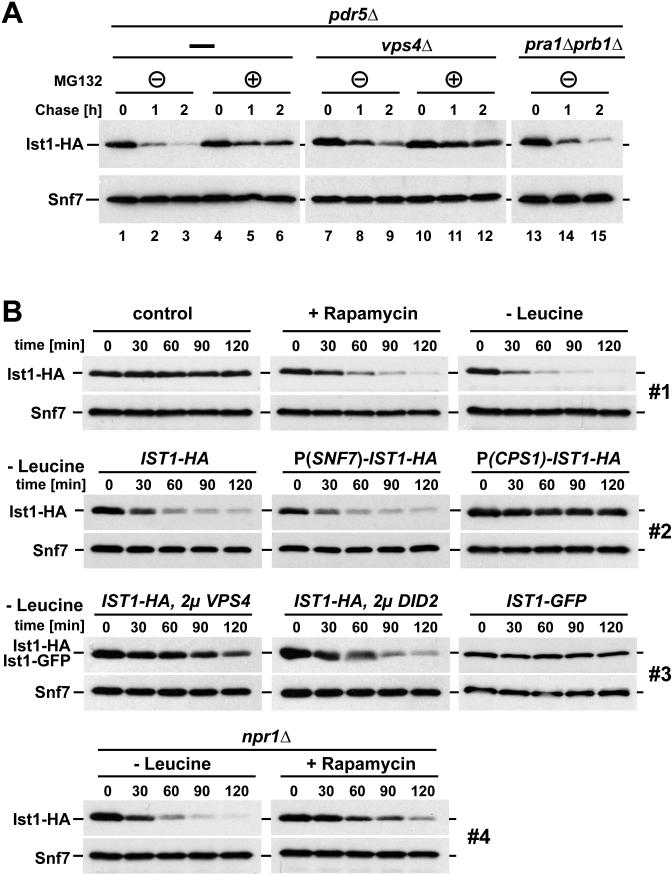
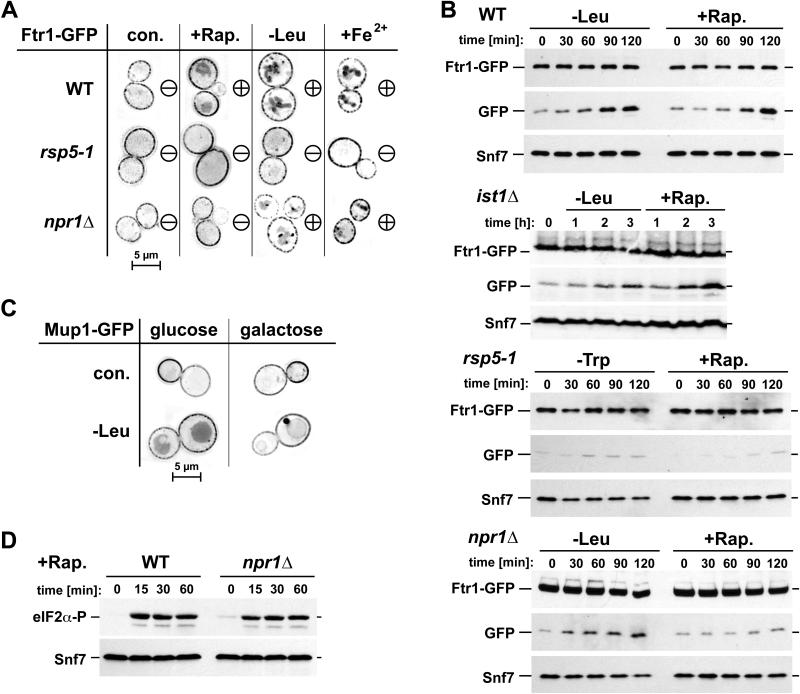
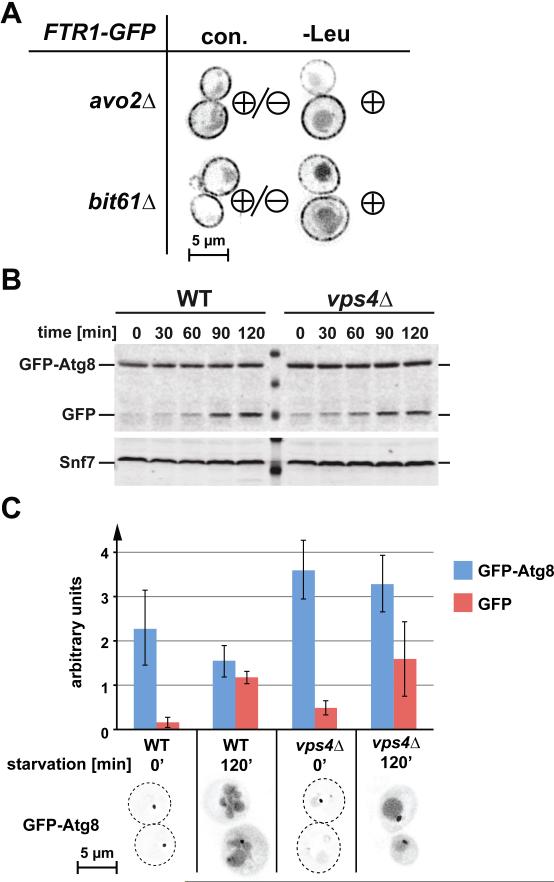
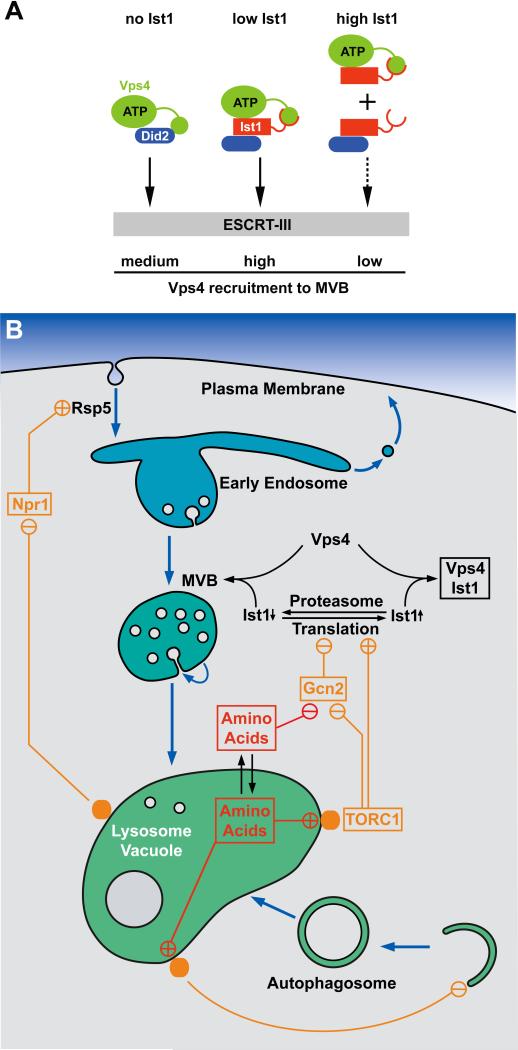
The multivesicular body (MVB) pathway delivers membrane proteins to the lumen of the vacuole/lysosome for degradation. The resulting amino acids are transported to the cytoplasm for reuse in protein synthesis. Our study shows that this amino acid recycling system plays an essential role in the adaptation of cells to starvation conditions. Cells respond to amino acid starvation by upregulating both endocytosis and the MVB pathway, thereby providing amino acids through increased protein turnover. Our data suggest that increased Rsp5-dependent ubiquitination of membrane proteins and a drop in Ist1 levels, a negative regulator of endosomal sorting complex required for transport (ESCRT) activity, cause this response. Furthermore, we found that target of rapamycin complex 1 (TORC1) and a second, unknown nutrient-sensing system are responsible for the starvation-induced protein turnover. Together, the data indicate that protein synthesis and turnover are linked by a common regulatory system that ensures adaptation and survival under nutrient-stress conditions.


Figures

Figure 1
Figure 1
The MVB pathway is instrumental in maintaining cellular viability during starvation. Survival of auxotrophic wild-type and mutant strains in YNB (-Leu) (A) or YNB (-Trp) (B) over five days. The data show the average of three parallel experiments (+/- standard deviation).
Figure 2
Figure 2
The MVB pathway is important for maintaining amino acid levels during starvation. (A) Analysis of free cellular amino acid content in leucine auxotrophic wild-type (leu2Δ) and vps4Δ (vps4Δleu2Δ) cells following a shift from YNB Complete Synthetic Medium (CSM) to YNB (-Leu). Charts indicate changes in cellular amino acid content relative to starting conditions. (B) Graphical representation of changes in cellular leucine levels relative to starting point in wild-type and vps4Δ cells as shown in (A).
Figure 3
Figure 3
Regulation of Vps4 by Ist1. (A) In vitro binding studies using recombinant Vps4(E233Q), Ist1 and GST-Did2(CT) (amino acids 113-204). GST-Did2(CT) was immobilized on GSH-sepharose and an approximately equimolar amount of Vps4(E233Q) was added in the presence of ATP. The Ist1 concentrations were varied from zero to approximately four times the molar amount of Vps4(E233Q). Bound and unbound fractions were analyzed by SDS-PAGE and coomassie staining, and the amount of bound Vps4(E233Q) was determined by densitometric scanning. The obtained values were normalized according to the amount of bound GST-Did2(CT), then plotted relative to the negative control (no GST-Did2(CT) = 0) and the maximum signal (1xIst1 = 1). (B) Survival of wild-type yeast, yeast expressing a dominant-negative version of Vps4 (vps4E233Q, pMB66), and yeast with GAL1-driven overexpression of Ist1 over a period of five days. The data show the average of three parallel experiments (+/- standard deviation). (C) Steady state localization of three permeases, Ftr1-GFP (iron), Fur4-GFP (uracil), and Can1-GFP (arginine) after extended exponential phase growth in WT and ist1Δ cells. Images were inverted for better visualization (brightest GFP signal appears black). The total and internal (excluding plasma membrane) GFP signal was quantified from 20 cells of each microscopy set. The graph shows the percentage of cells with a particular range of internal-to-total GFP signal. Analysis using the Kolmogorov-Smirnov test indicated that all discussed differences are statistically relevant.
Figure 4
Figure 4
Ist1 protein levels mirror the translational activity of the cell. (A) Time-course samples analyzed by Western blot to detect HA-tagged Ist1 protein levels (expressed from pMB241) and levels of phospho-eIF2α in MBY63 grown in YNB (-Ura) medium. Snf7 is a loading control. The same samples were analyzed for free amino acid content to track changes relative to starting conditions throughout growth. Red bar indicates the transitional point at hour six, wherein cellular free lysine levels drop dramatically, Ist1 protein levels begin to decline, and phosphorylation of eIF2α increases. (B) Western blot analysis and quantitative RT-PCR performed on samples collected over a 10 hour period encompassing the entire yeast growth curve (black trendline shows OD600 of culture). The strain contains a genomically integrated HA-tag downstream of the native IST1 locus. Snf7 is a loading control. Blue trendline shows IST1 mRNA levels relative to actin. Red line represents densitometric quantitation of Ist1-HA protein levels from the blot shown (relative to Snf7).
Figure 5
Figure 5
Ist1 is degraded by the proteasome, and its levels drop dramatically during starvation conditions. (A) Ist1-HA protein levels (expressed from pMB241) of exponentially growing cells (OD600 = 0.7) were analyzed at intervals following cycloheximide addition in pdr5Δ, pdr5Δvps4Δ, and pra1Δprb1Δ cells in the presence or absence of the proteasomal inhibitor MG132. Snf7 is a loading control. (B) Western blot detection of Ist1 protein degradation of under different conditions. All treatments and collections were performed on exponentially growing cells. Individual sets (1-4) were obtained with parallel sample collection, preparation, and film exposure to ensure comparability. Snf7 serves as a loading control. P(SNF7)-IST1-HA and P(CPS1)-IST1-HA refer to non-endogenous promoters driving IST1-HA expression. 2μ VPS4 and 2μ DID2 indicate strains overexpressing the corresponding proteins Vps4 and Did2, respectively, using a high-copy vector.
Figure 6
Figure 6
Starvation conditions cause downregulation of Ftr1 and Mup1. (A) Localization of Ftr1-GFP in exponentially growing cells with no treatment (con.) or after 45 minutes of rapamycin treatment (+Rap.), leucine starvation (-Leu), or iron treatment (+Fe2+, 0.5 mM) in wild-type cells, cells expressing an rsp5 mutant allele (rsp5-1), or npr1Δ cells. ‘Minus’ (-) designates minimal internalization of Ftr1, ‘plus’ (+) designates heightened internalization and accompanying late endosomal/vacuolar staining. (B) Time-course Western blot analysis of Ftr1-GFP stability with amino acid starvation (-Leu, -Trp) or rapamycin treatment (+Rap.) in WT, ist1Δ, cells expressing defective Rsp5 (rsp5-1, this strain is a leucine-autotroph and thus tryptophan-depletion is used for starvation), or npr1Δ cells. Blots show full length Ftr1-GFP, free GFP (cleaved from chimera in vacuole), and Snf7 as a loading control. (C) Localization of Mup1-GFP in cells overexpressing IST1-HA from a galactoseinducable promoter (Ist1 levels are normal when grown in glucose). Cells with no treatment (con.) or after 45 min leucine starvation (-Leu) were analyzed by fluorescence microscopy. (D) Western blot analysis of eIF2α phosphorylation upon rapamycin-treatment of wild-type and npr1Δ cells using a phospho-specific antibody.
Figure 7
Figure 7
TORC2 does not mediate starvation-induced downregulation of Ftr1; autophagy is not inhibited in ESCRT mutants. (A) Localization of Ftr1-GFP in the TORC2-deletion mutants avo2Δ and bit61Δ under normal conditions (con.) and following 1 hr. of leucine starvation. ‘Minus’ (-) designates minimal internalization of Ftr1, ‘plus’ (+) designates heightened internalization and accompanying late endosomal/vacuolar staining. (B) Wild-type and vps4Δ cells expressing GFPAtg8 were starved for leucine at time=0 following 24 hours of continuous growth. Samples were taken at indicated time points and analyzed by anti-GFP Western blot. (C) Fluorescence microscopy of the cells used for the Western blot analysis shown in B. The amount of GFP-Atg8 and its GFP-containing degradation product were determined based on the Western blot shown in B and two other Western blots performed in parallel experiments (amounts are shown relative to loading control Snf7, +/- standard deviation).
Figure 8
Figure 8
Regulation of translation, autophagy and the MVB pathway by nutrient-sensing systems. (A) Model for the regulation of Vps4 recruitment to ESCRT-III by cellular Ist1 levels. (B) Model for the concerted regulation of translation initiation, autophagy, the MVB pathway and endocytosis by amino acid levels.

References

    1. Sonenberg N, Hinnebusch AG. Regulation of translation initiation in eukaryotes: mechanisms and biological targets. Cell. 2009;136(4):731–745. - PMC - PubMed
    1. Wang X, Proud CG. Nutrient control of TORC1, a cell-cycle regulator. Trends Cell Biol. 2009;19(6):260–267. - PubMed
    1. Wullschleger S, Loewith R, Hall MN. TOR signaling in growth and metabolism. Cell. 2006;124(3):471–484. - PubMed
    1. Staschke KA, Dey S, Zaborske JM, Palam LR, McClintick JN, Pan T, Edenberg HJ, Wek RC. Integration of general amino acid control and TOR regulatory pathways in nitrogen assimilation in yeast. J Biol Chem. 2010 - PMC - PubMed
    1. Chang YY, Juhasz G, Goraksha-Hicks P, Arsham AM, Mallin DR, Muller LK, Neufeld TP. Nutrient-dependent regulation of autophagy through the target of rapamycin pathway. Biochem Soc Trans. 2009;37(Pt 1):232–236. - PubMed

Publication types

MeSH terms

LinkOut - more resources